Races in Zion, Illinois (IL) Detailed Stats
Data:
Races - White alone (%)
Races - White alone (% change since 2000)
Races - Black alone (%)
Races - Black alone (% change since 2000)
Races - American Indian alone (%)
Races - American Indian alone (% change since 2000)
Races - Asian alone (%)
Races - Asian alone (% change since 2000)
Races - Hispanic (%)
Races - Hispanic (% change since 2000)
Races - Native Hawaiian and Other Pacific Islander alone (%)
Races - Native Hawaiian and Other Pacific Islander alone (% change since 2000)
Races - Two or more races(%)
Races - Two or more races(% change since 2000)
Races - Other race alone (%)
Races - Other race alone (% change since 2000)
Racial diversity
Place of birth - Born in state of residence (%)
Place of birth - Born in state of residence (%) - White
Place of birth - Born in state of residence (%) - Black or African American
Place of birth - Born in state of residence (%) - Asian
Place of birth - Born in state of residence (%) - Hispanic or Latino
Place of birth - Born in state of residence (%) - American Indian and Alaska Native
Place of birth - Born in state of residence (%) - Multirace
Place of birth - Born in state of residence (%) - Other Race
Place of birth - Born in other state (%)
Place of birth - Born in other state (%) - White
Place of birth - Born in other state (%) - Black or African American
Place of birth - Born in other state (%) - Asian
Place of birth - Born in other state (%) - Hispanic or Latino
Place of birth - Born in other state (%) - American Indian and Alaska Native
Place of birth - Born in other state (%) - Multirace
Place of birth - Born in other state (%) - Other Race
Place of birth - Native, outside of US (%)
Place of birth - Native, outside of US (%) - White
Place of birth - Native, outside of US (%) - Black or African American
Place of birth - Native, outside of US (%) - Asian
Place of birth - Native, outside of US (%) - Hispanic or Latino
Place of birth - Native, outside of US (%) - American Indian and Alaska Native
Place of birth - Native, outside of US (%) - Multirace
Place of birth - Native, outside of US (%) - Other Race
Place of birth - Foreign born (%)
Place of birth - Foreign born (%) - White
Place of birth - Foreign born (%) - Black or African American
Place of birth - Foreign born (%) - Asian
Place of birth - Foreign born (%) - Hispanic or Latino
Place of birth - Foreign born (%) - American Indian and Alaska Native
Place of birth - Foreign born (%) - Multirace
Place of birth - Foreign born (%) - Other Race
Residents speaking English at home (%)
Residents speaking English at home - Born in the United States (%)
Residents speaking English at home - Native, born elsewhere (%)
Residents speaking English at home - Foreign born (%)
Residents speaking Spanish at home (%)
Residents speaking Spanish at home - Born in the United States (%)
Residents speaking Spanish at home - Native, born elsewhere (%)
Residents speaking Spanish at home - Foreign born (%)
Residents speaking other language at home (%)
Residents speaking other language at home - Born in the United States (%)
Residents speaking other language at home - Native, born elsewhere (%)
Residents speaking other language at home - Foreign born (%)
Marital status - Never married (%)
Marital status - Now married (%)
Marital status - Separated (%)
Marital status - Widowed (%)
Marital status - Divorced (%)
Ancestries Reported - Arab (%)
Ancestries Reported - Czech (%)
Ancestries Reported - Danish (%)
Ancestries Reported - Dutch (%)
Ancestries Reported - English (%)
Ancestries Reported - French (%)
Ancestries Reported - French Canadian (%)
Ancestries Reported - German (%)
Ancestries Reported - Greek (%)
Ancestries Reported - Hungarian (%)
Ancestries Reported - Irish (%)
Ancestries Reported - Italian (%)
Ancestries Reported - Lithuanian (%)
Ancestries Reported - Norwegian (%)
Ancestries Reported - Polish (%)
Ancestries Reported - Portuguese (%)
Ancestries Reported - Russian (%)
Ancestries Reported - Scotch-Irish (%)
Ancestries Reported - Scottish (%)
Ancestries Reported - Slovak (%)
Ancestries Reported - Subsaharan African (%)
Ancestries Reported - Swedish (%)
Ancestries Reported - Swiss (%)
Ancestries Reported - Ukrainian (%)
Ancestries Reported - United States (%)
Ancestries Reported - Welsh (%)
Ancestries Reported - West Indian (%)
Ancestries Reported - Other (%)
Geographical mobility - Same house 1 year ago (%)
Geographical mobility - Same house 1 year ago (%) - White
Geographical mobility - Same house 1 year ago (%) - Black or African American
Geographical mobility - Same house 1 year ago (%) - Asian
Geographical mobility - Same house 1 year ago (%) - Hispanic or Latino
Geographical mobility - Same house 1 year ago (%) - American Indian and Alaska Native
Geographical mobility - Same house 1 year ago (%) - Multirace
Geographical mobility - Same house 1 year ago (%) - Other Race
Geographical mobility - Moved within same county (%)
Geographical mobility - Moved within same county (%) - White
Geographical mobility - Moved within same county (%) - Black or African American
Geographical mobility - Moved within same county (%) - Asian
Geographical mobility - Moved within same county (%) - Hispanic or Latino
Geographical mobility - Moved within same county (%) - American Indian and Alaska Native
Geographical mobility - Moved within same county (%) - Multirace
Geographical mobility - Moved within same county (%) - Other Race
Geographical mobility - Moved from different county within same state (%)
Geographical mobility - Moved from different county within same state (%) - White
Geographical mobility - Moved from different county within same state (%) - Black or African American
Geographical mobility - Moved from different county within same state (%) - Asian
Geographical mobility - Moved from different county within same state (%) - Hispanic or Latino
Geographical mobility - Moved from different county within same state (%) - American Indian and Alaska Native
Geographical mobility - Moved from different county within same state (%) - Multirace
Geographical mobility - Moved from different county within same state (%) - Other Race
Geographical mobility - Moved from different state (%)
Geographical mobility - Moved from different state (%) - White
Geographical mobility - Moved from different state (%) - Black or African American
Geographical mobility - Moved from different state (%) - Asian
Geographical mobility - Moved from different state (%) - Hispanic or Latino
Geographical mobility - Moved from different state (%) - American Indian and Alaska Native
Geographical mobility - Moved from different state (%) - Multirace
Geographical mobility - Moved from different state (%) - Other Race
Geographical mobility - Moved from abroad (%)
Geographical mobility - Moved from abroad (%) - White
Geographical mobility - Moved from abroad (%) - Black or African American
Geographical mobility - Moved from abroad (%) - Asian
Geographical mobility - Moved from abroad (%) - Hispanic or Latino
Geographical mobility - Moved from abroad (%) - American Indian and Alaska Native
Geographical mobility - Moved from abroad (%) - Multirace
Geographical mobility - Moved from abroad (%) - Other Race
Place of birth for the foreign-born population - Ireland (%)
Place of birth for the foreign-born population - Denmark (%)
Place of birth for the foreign-born population - Norway (%)
Place of birth for the foreign-born population - Sweden (%)
Place of birth for the foreign-born population - United Kingdom (%)
Place of birth for the foreign-born population - England (%)
Place of birth for the foreign-born population - Scotland (%)
Place of birth for the foreign-born population - Other Northern Europe (%)
Place of birth for the foreign-born population - Austria (%)
Place of birth for the foreign-born population - Belgium (%)
Place of birth for the foreign-born population - France (%)
Place of birth for the foreign-born population - Germany (%)
Place of birth for the foreign-born population - Netherlands (%)
Place of birth for the foreign-born population - Switzerland (%)
Place of birth for the foreign-born population - Other Western Europe (%)
Place of birth for the foreign-born population - Greece (%)
Place of birth for the foreign-born population - Italy (%)
Place of birth for the foreign-born population - Portugal (%)
Place of birth for the foreign-born population - Spain (%)
Place of birth for the foreign-born population - Other Southern Europe (%)
Place of birth for the foreign-born population - Albania (%)
Place of birth for the foreign-born population - Belarus (%)
Place of birth for the foreign-born population - Bosnia and Herzegovina (%)
Place of birth for the foreign-born population - Bulgaria (%)
Place of birth for the foreign-born population - Croatia (%)
Place of birth for the foreign-born population - Czechoslovakia (%)
Place of birth for the foreign-born population - Hungary (%)
Place of birth for the foreign-born population - Latvia (%)
Place of birth for the foreign-born population - Lithuania (%)
Place of birth for the foreign-born population - North Macedonia (Macedonia) (%)
Place of birth for the foreign-born population - Moldova (%)
Place of birth for the foreign-born population - Poland (%)
Place of birth for the foreign-born population - Romania (%)
Place of birth for the foreign-born population - Russia (%)
Place of birth for the foreign-born population - Serbia (%)
Place of birth for the foreign-born population - Ukraine (%)
Place of birth for the foreign-born population - Other Eastern Europe (%)
Place of birth for the foreign-born population - China (%)
Place of birth for the foreign-born population - Hong Kong (%)
Place of birth for the foreign-born population - Taiwan (%)
Place of birth for the foreign-born population - Japan (%)
Place of birth for the foreign-born population - Korea (%)
Place of birth for the foreign-born population - Other Eastern Asia (%)
Place of birth for the foreign-born population - Afghanistan (%)
Place of birth for the foreign-born population - Bangladesh (%)
Place of birth for the foreign-born population - India (%)
Place of birth for the foreign-born population - Iran (%)
Place of birth for the foreign-born population - Kazakhstan (%)
Place of birth for the foreign-born population - Nepal (%)
Place of birth for the foreign-born population - Pakistan (%)
Place of birth for the foreign-born population - Sri Lanka (%)
Place of birth for the foreign-born population - Uzbekistan (%)
Place of birth for the foreign-born population - Other South Central Asia (%)
Place of birth for the foreign-born population - Burma (%)
Place of birth for the foreign-born population - Cambodia (%)
Place of birth for the foreign-born population - Indonesia (%)
Place of birth for the foreign-born population - Laos (%)
Place of birth for the foreign-born population - Malaysia (%)
Place of birth for the foreign-born population - Philippines (%)
Place of birth for the foreign-born population - Singapore (%)
Place of birth for the foreign-born population - Thailand (%)
Place of birth for the foreign-born population - Vietnam (%)
Place of birth for the foreign-born population - Other South Eastern Asia (%)
Place of birth for the foreign-born population - Armenia (%)
Place of birth for the foreign-born population - Iraq (%)
Place of birth for the foreign-born population - Israel (%)
Place of birth for the foreign-born population - Jordan (%)
Place of birth for the foreign-born population - Kuwait (%)
Place of birth for the foreign-born population - Lebanon (%)
Place of birth for the foreign-born population - Saudi Arabia (%)
Place of birth for the foreign-born population - Syria (%)
Place of birth for the foreign-born population - Turkey (%)
Place of birth for the foreign-born population - Yemen (%)
Place of birth for the foreign-born population - Other Western Asia (%)
Place of birth for the foreign-born population - Eritrea (%)
Place of birth for the foreign-born population - Ethiopia (%)
Place of birth for the foreign-born population - Kenya (%)
Place of birth for the foreign-born population - Somalia (%)
Place of birth for the foreign-born population - Uganda (%)
Place of birth for the foreign-born population - Zimbabwe (%)
Place of birth for the foreign-born population - Other Eastern Africa (%)
Place of birth for the foreign-born population - Cameroon (%)
Place of birth for the foreign-born population - Congo (%)
Place of birth for the foreign-born population - Democratic Republic of Congo (Zaire) (%)
Place of birth for the foreign-born population - Other Middle Africa (%)
Place of birth for the foreign-born population - Egypt (%)
Place of birth for the foreign-born population - Morocco (%)
Place of birth for the foreign-born population - Sudan (%)
Place of birth for the foreign-born population - Other Northern Africa (%)
Place of birth for the foreign-born population - South Africa (%)
Place of birth for the foreign-born population - Other Southern Africa (%)
Place of birth for the foreign-born population - Cabo Verde (%)
Place of birth for the foreign-born population - Ghana (%)
Place of birth for the foreign-born population - Liberia (%)
Place of birth for the foreign-born population - Nigeria (%)
Place of birth for the foreign-born population - Senegal (%)
Place of birth for the foreign-born population - Sierra Leone (%)
Place of birth for the foreign-born population - Other Western Africa (%)
Place of birth for the foreign-born population - Australia (%)
Place of birth for the foreign-born population - New Zealand (%)
Place of birth for the foreign-born population - Fiji (%)
Place of birth for the foreign-born population - Micronesia (%)
Place of birth for the foreign-born population - Bahamas (%)
Place of birth for the foreign-born population - Barbados (%)
Place of birth for the foreign-born population - Cuba (%)
Place of birth for the foreign-born population - Dominica (%)
Place of birth for the foreign-born population - Dominican Republic (%)
Place of birth for the foreign-born population - Grenada (%)
Place of birth for the foreign-born population - Haiti (%)
Place of birth for the foreign-born population - Jamaica (%)
Place of birth for the foreign-born population - St. Vincent and the Grenadines (%)
Place of birth for the foreign-born population - Trinidad and Tobago (%)
Place of birth for the foreign-born population - West Indies (%)
Place of birth for the foreign-born population - Other Caribbean (%)
Place of birth for the foreign-born population - Belize (%)
Place of birth for the foreign-born population - Costa Rica (%)
Place of birth for the foreign-born population - El Salvador (%)
Place of birth for the foreign-born population - Guatemala (%)
Place of birth for the foreign-born population - Honduras (%)
Place of birth for the foreign-born population - Mexico (%)
Place of birth for the foreign-born population - Nicaragua (%)
Place of birth for the foreign-born population - Panama (%)
Place of birth for the foreign-born population - Other Central America (%)
Place of birth for the foreign-born population - Argentina (%)
Place of birth for the foreign-born population - Bolivia (%)
Place of birth for the foreign-born population - Brazil (%)
Place of birth for the foreign-born population - Chile (%)
Place of birth for the foreign-born population - Colombia (%)
Place of birth for the foreign-born population - Ecuador (%)
Place of birth for the foreign-born population - Guyana (%)
Place of birth for the foreign-born population - Peru (%)
Place of birth for the foreign-born population - Uruguay (%)
Place of birth for the foreign-born population - Venezuela (%)
Place of birth for the foreign-born population - Other South America (%)
Place of birth for the foreign-born population - Canada (%)
Place of birth for the foreign-born population - Other Northern America (%)
Place of birth for the foreign-born population - Other (%)
Latest news about races in Zion, IL collected exclusively by city-data.com from local newspapers, TV, and radio stations
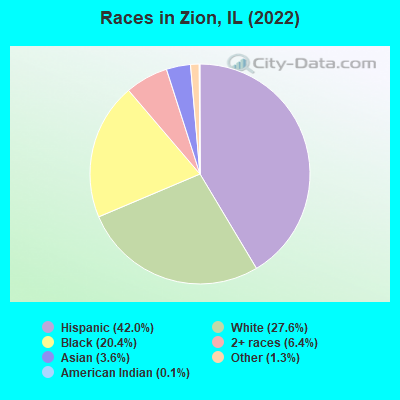
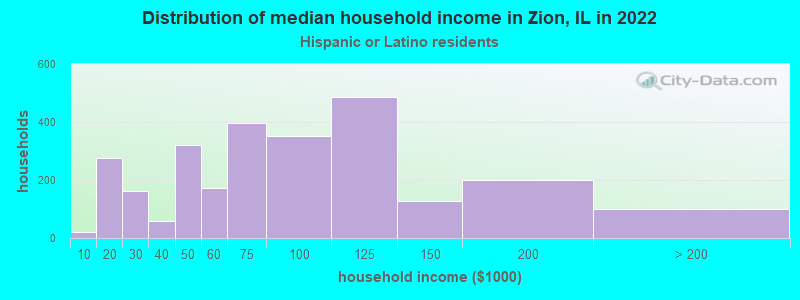
According to 2022 data, the most numerous races in Zion, IL are White alone (6,741 residents), Hispanic (10,255 residents), and Black alone (4,976 residents). 66.2% of Zion residents speak English at home. 16.7% of Zion, IL residents are foreign-born (12.0% born in Latin America, 3.3% born in Asia), which is 16.0% greater than the foreign-born rate of 14.0% across the entire state of Illinois.
Race distribution in Zion
2000 2022
8,424,140 67.8% White alone 1,856,152 14.9% Black alone 1,530,262 12.3% Hispanic 419,916 3.4% Asian alone 153,996 1.2% Two or more races 13,479 0.1% Other race alone 18,232 0.1% American Indian alone 3,116 0.03% Native Hawaiian and Other
7,356,301 58.5% White alone 2,299,726 18.3% Hispanic 1,660,423 13.2% Black alone 747,296 5.9% Asian alone 458,599 3.6% Two or more races 45,386 0.4% Other race alone 10,405 0.08% American Indian alone 3,896 0.03% Native Hawaiian and Other
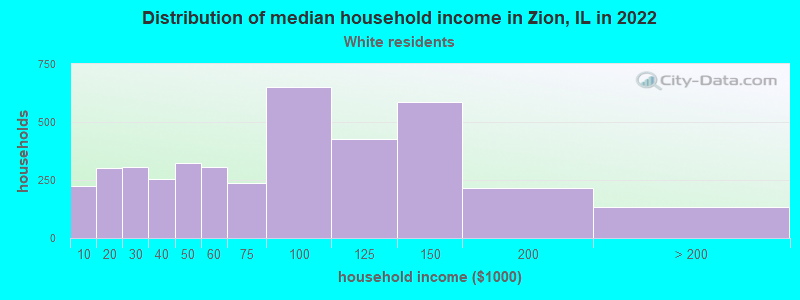
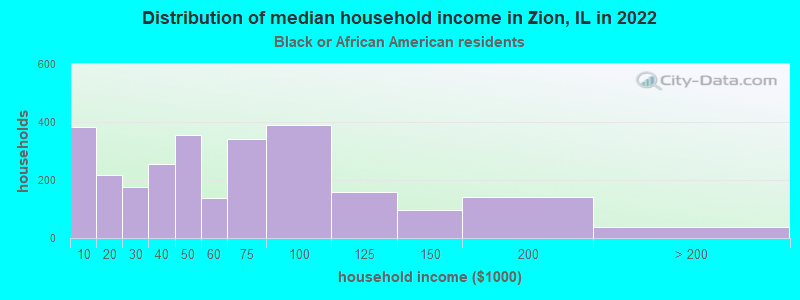
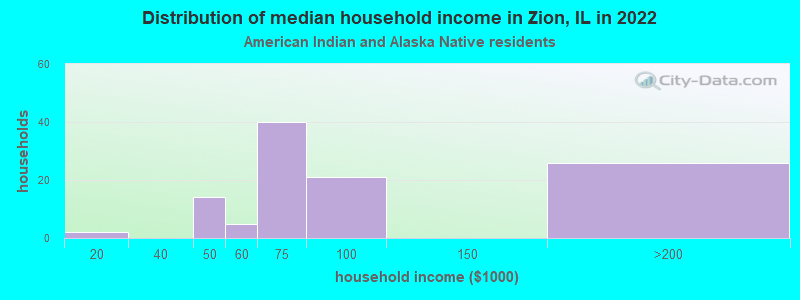
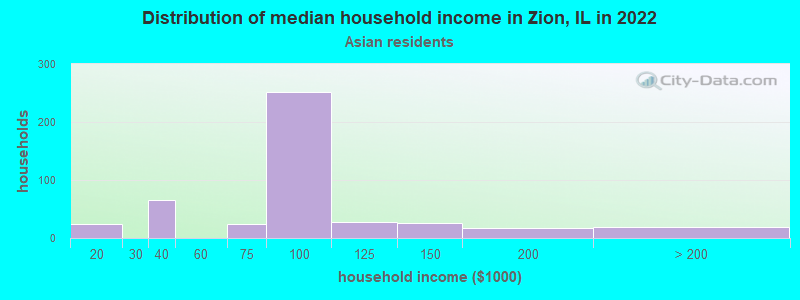
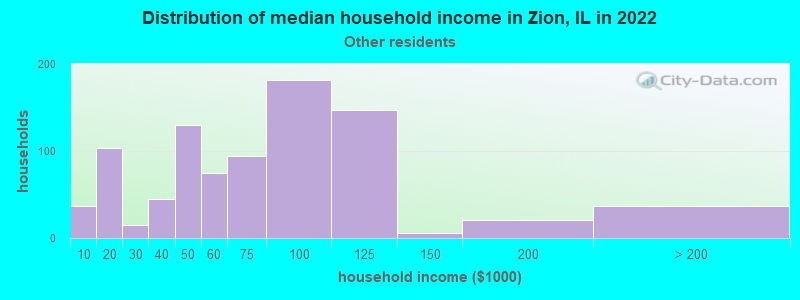
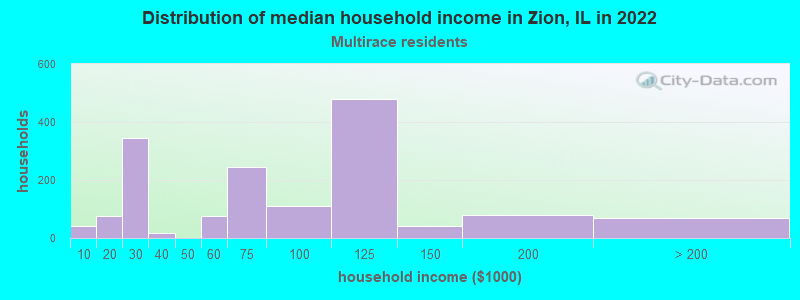
Income and house value in Zion Median household income in 2022 $69,514 White non-Hispanic householders$47,665 Black householders$61,185 American Indian and Alaska Native householders$91,325 Asian householders$67,809 Some other race householders$61,166 Two or more races householders$74,023 Hispanic or Latino race householdersMedian 2022 house value $172,926 White Non-Hispanic householders$162,239 Black or African American householders$241,207 American Indian or Alaska Native householders $208,254 Asian householders$153,481 Some other race householders$173,966 Two or more races householders$159,270 Hispanic or Latino householders
Median age by race in Zion
38.6 Median age for White residents35.9 41.3 35.2 Median age for Black or African American residents34.1 38.0 26.8 Median age for American Indian / Alaska Native residents24.0 26.3 38.4 Median age for Asian residents27.5 46.2 -593,236,714.4 Median age for Native Hawaiian / Pacific Islander residents-658,536,584.7 -576,015,108.0 36.0 Median age for Other race residents36.9 35.5 22.1 Median age for Two or more races residents19.7 22.8 50.1 Median age for White alone residents44.4 53.4 24.1 Median age for Hispanic or Latino residents25.1 23.4
Owner/renter occupied households by race in Zion
House owners and renters - White residents 2,507 63.8% Owner occupied1,420 36.2% Renter occupiedHouse owners and renters - Black or African American residents 729 29.8% Owner occupied1,720 70.2% Renter occupiedHouse owners and renters - American Indian / Alaska Native residents 103 100.0% Owner occupiedHouse owners and renters - Asian residents 178 46.2% Owner occupied207 53.8% Renter occupiedHouse owners and renters - Other race residents 666 74.6% Owner occupied227 25.4% Renter occupiedHouse owners and renters - Two or more races residents 1,082 68.4% Owner occupied499 31.6% Renter occupiedHouse owners and renters - White alone residents 2,067 64.3% Owner occupied1,147 35.7% Renter occupiedHouse owners and renters - Hispanic or Latino residents 1,832 71.6% Owner occupied727 28.4% Renter occupied
Language usage in Zion
English speakers - Total 66.2% of residents of Zion speak English at home.
28.8% of residents speak Spanish at home 4,089 62.2% Speak English very well2,482 37.8% Speak English less than very well4.9% of residents speak other language at home 648 58.5% Speak English very well460 41.5% Speak English less than very well
English speakers - Born in the United States 87.0% of residents of Zion speak English at home.
13.6% of residents speak Spanish at home 539 89.7% Speak English very well62 10.3% Speak English less than very well0.6% of residents speak other language at home 28 100.0% Speak English very well
English speakers - Native, born elsewhere 36.5% of residents of Zion speak English at home.
59.0% of residents speak Spanish at home 98 46.7% Speak English very well112 53.3% Speak English less than very well
English speakers - Foreign-born 14.9% of residents of Zion speak English at home.
64.7% of residents speak Spanish at home 786 28.7% Speak English very well1,951 71.3% Speak English less than very well21.1% of residents speak other language at home 483 54.2% Speak English very well408 45.8% Speak English less than very well
White (Caucasian) - Speak only English Native:
84.2% (6,844)Foreign-born:
10.4% (92)
White (Caucasian) - Speak another language Native:
12.4% (1,006)Foreign-born:
83.7% (742)
Black or African American - Speak only English Native:
93.0% (4,682)Foreign-born:
18.8% (67)
Black or African American - Speak another language Native:
7.4% (370)Foreign-born:
81.3% (291)
American Indian / Alaska Native - Speak another language Native:
26.4% (124)Foreign-born:
100.0% (107)
Asian - Speak only English Native:
75.7% (68)Foreign-born:
25.2% (197)
Other race - Speak only English Native:
29.5% (487)Foreign-born:
18.5% (217)
Other race - Speak another language Native:
70.1% (1,156)Foreign-born:
84.6% (995)
Two or more races - Speak only English Native:
63.8% (2,756)Foreign-born:
9.7% (108)
Two or more races - Speak another language Native:
34.7% (1,499)Foreign-born:
89.6% (996)
White alone - Speak only English Native:
97.9% (6,237)Foreign-born:
36.4% (56)
White alone - Speak another language Native:
2.2% (142)Foreign-born:
64.0% (99)
Hispanic or Latino - Speak only English Native:
41.1% (2,612)Foreign-born:
10.5% (315)
Hispanic or Latino - Speak another language Native:
59.3% (3,763)Foreign-born:
90.4% (2,714)
Foreign-born residents in Zion 4,073 residents are foreign born (12.0% Latin America , 3.3% Asia ).
This city:
16.7%Illinois:
14.1%
Marital status for residents in Zion Marital status - White (Caucasian) population 15 years and over
Males 42.3% Never married43.7% Now married0.7% Separated2.7% Widowed10.7% DivorcedFemales 28.8% Never married41.6% Now married2.8% Separated10.6% Widowed16.3% DivorcedWomen who gave birth in the past 12 months Now married:
69.0% (69)Unmarried:
31.0% (31)
Women who did not give birth in the past 12 months Now married:
36.9% (787)Unmarried:
63.1% (1,343)
Marital status - Black or African American population 15 years and over
Males 52.5% Never married28.2% Now married1.5% Separated2.1% Widowed15.8% DivorcedFemales 50.2% Never married32.5% Now married4.1% Separated6.9% Widowed6.3% DivorcedWomen who gave birth in the past 12 months Now married:
0.0% (0)Unmarried:
100.0% (52)
Women who did not give birth in the past 12 months Now married:
33.0% (355)Unmarried:
67.0% (721)
Marital status - American Indian / Alaska Native population 15 years and over
Males 53.6% Never married46.4% Now married0.0% Separated0.0% Widowed0.0% DivorcedFemales 45.9% Never married45.3% Now married0.0% Separated0.0% Widowed8.7% DivorcedWomen who did not give birth in the past 12 months Now married:
38.8% (83)Unmarried:
61.2% (132)
Marital status - Asian population 15 years and over
Males 29.9% Never married60.5% Now married5.4% Separated0.0% Widowed4.2% DivorcedFemales 32.2% Never married47.9% Now married0.0% Separated4.1% Widowed15.7% DivorcedWomen who did not give birth in the past 12 months Now married:
26.5% (60)Unmarried:
73.5% (165)
Marital status - Other race population 15 years and over
Males 40.2% Never married55.7% Now married0.0% Separated0.7% Widowed3.4% DivorcedFemales 34.9% Never married54.1% Now married1.1% Separated0.0% Widowed9.8% DivorcedWomen who did not give birth in the past 12 months Now married:
50.3% (399)Unmarried:
49.7% (394)
Marital status - Two or more races population 15 years and over
Males 41.3% Never married45.8% Now married0.0% Separated0.7% Widowed12.2% DivorcedFemales 60.9% Never married23.5% Now married0.0% Separated7.7% Widowed7.9% DivorcedWomen who did not give birth in the past 12 months Now married:
23.6% (503)Unmarried:
76.4% (1,624)
Marital status - White alone, not Hispanic / Latino population 15 years and over
Males 41.7% Never married43.3% Now married0.9% Separated1.7% Widowed12.4% DivorcedFemales 25.1% Never married43.7% Now married0.2% Separated14.0% Widowed17.0% DivorcedWomen who gave birth in the past 12 months Now married:
63.5% (38)Unmarried:
36.5% (22)
Women who did not give birth in the past 12 months Now married:
31.2% (389)Unmarried:
68.8% (857)
Marital status - Hispanic or Latino population 15 years and over
Males 45.4% Never married45.6% Now married0.0% Separated2.0% Widowed6.9% DivorcedFemales 43.4% Never married38.0% Now married3.4% Separated3.5% Widowed11.8% DivorcedWomen who gave birth in the past 12 months Now married:
76.0% (39)Unmarried:
24.0% (12)
Women who did not give birth in the past 12 months Now married:
39.0% (1,198)Unmarried:
61.0% (1,876)
Ancestries in Zion
483 4.0% German322 2.7% English289 2.4% Irish218 1.8% American111 0.9% Italian98 0.8% European76 0.6% Norwegian64 0.5% Swedish57 0.5% Haitian56 0.5% Polish54 0.5% French54 0.5% Zimbabwean48 0.4% Romanian46 0.4% Belizean31 0.3% Russian29 0.2% Finnish28 0.2% British25 0.2% Jamaican20 0.2% Scotch-Irish19 0.2% African18 0.2% Dutch9 0.08% Canadian8 0.07% Belgian8 0.07% Czech6 0.05% Serbian
Geographical mobility in Zion Same house 1 year ago 8,602 90.3% White (Caucasian)5,016 90.6% Black or African American534 99.7% American Indian / Alaska Native862 96.9% Asian2,157 75.0% Other race5,960 95.6% Two or more races6,060 90.2% White alone, not Hispanic / Latino8,980 89.0% Hispanic or LatinoMoved within same county 339 3.6% White / Caucasian435 7.9% Black or African American438 15.2% Other race150 2.4% Two or more races155 2.3% White alone, not Hispanic / Latino666 6.6% Hispanic or LatinoMoved within same state 226 2.4% White / Caucasian145 2.6% Black or African American152 5.3% Other race57 0.9% Two or more races223 3.3% White alone, not Hispanic / Latino255 2.5% Hispanic or LatinoMoved from different state 329 3.5% White / Caucasian70 1.3% Black or African American13 0.5% Other race56 0.9% Two or more races270 4.0% White alone, not Hispanic / Latino128 1.3% Hispanic or LatinoMoved from abroad 17 0.2% White9 1.1% Asian52 0.8% Two or more races37 0.4% Hispanic or Latino
Children Nativity (place of birth) in Zion
Children under 6 years - Living with two parents Both parents native 341 100.0% NativeBoth parents foreign-born 244 90.5% Native26 9.5% Foreign-bornOne native, one foreign-born parent 184 100.0% NativeChildren under 6 years - Living with one parent Native parent 826 100.0% NativeForeign-born parent 179 100.0% NativeChildren 6 to 17 years - Living with two parents Both parents native 900 100.0% NativeBoth parents foreign-born 851 91.0% Native84 9.0% Foreign-bornOne native, one foreign-born parent 991 100.0% NativeChildren 6 to 17 years - Living with one parent Native parent 1,162 100.0% NativeForeign-born parent 307 61.5% Native192 38.5% Foreign-born
Grandparents responsible for own grandchildren in Zion
Grandparents (30 to 59 years) White / Caucasian 69 55.8% Responsible for grandchildren55 44.2% Not responsible for grandchildrenBlack or African American 21 100.0% Responsible for grandchildrenTwo or more races 30 65.7% Responsible for grandchildren16 34.3% Not responsible for grandchildrenWhite alone, not Hispanic / Latino 52 89.9% Responsible for grandchildren6 10.1% Not responsible for grandchildrenHispanic or Latino 22 23.3% Responsible for grandchildren73 76.7% Not responsible for grandchildrenGrandparents (60 years and over) White / Caucasian 29 33.8% Responsible for grandchildren57 66.2% Not responsible for grandchildrenBlack or African American 18 14.3% Responsible for grandchildren106 85.7% Not responsible for grandchildrenTwo or more races 20 14.6% Responsible for grandchildren116 85.4% Not responsible for grandchildrenWhite alone, not Hispanic / Latino 32 49.8% Responsible for grandchildren33 50.2% Not responsible for grandchildrenHispanic or Latino 5 2.5% Responsible for grandchildren182 97.5% Not responsible for grandchildren