Roselle, New Jersey Submit your own pictures of this borough and show them to the world
OSM Map
General Map
Google Map
MSN Map
OSM Map
General Map
Google Map
MSN Map
OSM Map
General Map
Google Map
MSN Map
OSM Map
General Map
Google Map
MSN Map
Please wait while loading the map...
Population in 2022: 22,327 (100% urban, 0% rural). Population change since 2000: +4.9%Males: 10,326 Females: 12,001
March 2022 cost of living index in Roselle: 113.7 (more than average, U.S. average is 100) Percentage of residents living in poverty in 2022: 8.3%for White Non-Hispanic residents , 8.2% for Black residents , 6.1% for Hispanic or Latino residents , 68.6% for Native Hawaiian and other Pacific Islander residents , 8.6% for other race residents , 6.6% for two or more races residents )
Profiles of local businesses
Business Search - 14 Million verified businesses
Data:
Median household income ($)
Median household income (% change since 2000)
Household income diversity
Ratio of average income to average house value (%)
Ratio of average income to average rent
Median household income ($) - White
Median household income ($) - Black or African American
Median household income ($) - Asian
Median household income ($) - Hispanic or Latino
Median household income ($) - American Indian and Alaska Native
Median household income ($) - Multirace
Median household income ($) - Other Race
Median household income for houses/condos with a mortgage ($)
Median household income for apartments without a mortgage ($)
Races - White alone (%)
Races - White alone (% change since 2000)
Races - Black alone (%)
Races - Black alone (% change since 2000)
Races - American Indian alone (%)
Races - American Indian alone (% change since 2000)
Races - Asian alone (%)
Races - Asian alone (% change since 2000)
Races - Hispanic (%)
Races - Hispanic (% change since 2000)
Races - Native Hawaiian and Other Pacific Islander alone (%)
Races - Native Hawaiian and Other Pacific Islander alone (% change since 2000)
Races - Two or more races (%)
Races - Two or more races (% change since 2000)
Races - Other race alone (%)
Races - Other race alone (% change since 2000)
Racial diversity
Unemployment (%)
Unemployment (% change since 2000)
Unemployment (%) - White
Unemployment (%) - Black or African American
Unemployment (%) - Asian
Unemployment (%) - Hispanic or Latino
Unemployment (%) - American Indian and Alaska Native
Unemployment (%) - Multirace
Unemployment (%) - Other Race
Population density (people per square mile)
Population - Males (%)
Population - Females (%)
Population - Males (%) - White
Population - Males (%) - Black or African American
Population - Males (%) - Asian
Population - Males (%) - Hispanic or Latino
Population - Males (%) - American Indian and Alaska Native
Population - Males (%) - Multirace
Population - Males (%) - Other Race
Population - Females (%) - White
Population - Females (%) - Black or African American
Population - Females (%) - Asian
Population - Females (%) - Hispanic or Latino
Population - Females (%) - American Indian and Alaska Native
Population - Females (%) - Multirace
Population - Females (%) - Other Race
Coronavirus confirmed cases (May 23, 2024)
Deaths caused by coronavirus (May 23, 2024)
Coronavirus confirmed cases (per 100k population) (May 23, 2024)
Deaths caused by coronavirus (per 100k population) (May 23, 2024)
Daily increase in number of cases (May 23, 2024)
Weekly increase in number of cases (May 23, 2024)
Cases doubled (in days) (May 23, 2024)
Hospitalized patients (Apr 18, 2022)
Negative test results (Apr 18, 2022)
Total test results (Apr 18, 2022)
COVID Vaccine doses distributed (per 100k population) (Sep 19, 2023)
COVID Vaccine doses administered (per 100k population) (Sep 19, 2023)
COVID Vaccine doses distributed (Sep 19, 2023)
COVID Vaccine doses administered (Sep 19, 2023)
Likely homosexual households (%)
Likely homosexual households (% change since 2000)
Likely homosexual households - Lesbian couples (%)
Likely homosexual households - Lesbian couples (% change since 2000)
Likely homosexual households - Gay men (%)
Likely homosexual households - Gay men (% change since 2000)
Cost of living index
Median gross rent ($)
Median contract rent ($)
Median monthly housing costs ($)
Median house or condo value ($)
Median house or condo value ($ change since 2000)
Mean house or condo value by units in structure - 1, detached ($)
Mean house or condo value by units in structure - 1, attached ($)
Mean house or condo value by units in structure - 2 ($)
Mean house or condo value by units in structure by units in structure - 3 or 4 ($)
Mean house or condo value by units in structure - 5 or more ($)
Mean house or condo value by units in structure - Boat, RV, van, etc. ($)
Mean house or condo value by units in structure - Mobile home ($)
Median house or condo value ($) - White
Median house or condo value ($) - Black or African American
Median house or condo value ($) - Asian
Median house or condo value ($) - Hispanic or Latino
Median house or condo value ($) - American Indian and Alaska Native
Median house or condo value ($) - Multirace
Median house or condo value ($) - Other Race
Median resident age
Resident age diversity
Median resident age - Males
Median resident age - Females
Median resident age - White
Median resident age - Black or African American
Median resident age - Asian
Median resident age - Hispanic or Latino
Median resident age - American Indian and Alaska Native
Median resident age - Multirace
Median resident age - Other Race
Median resident age - Males - White
Median resident age - Males - Black or African American
Median resident age - Males - Asian
Median resident age - Males - Hispanic or Latino
Median resident age - Males - American Indian and Alaska Native
Median resident age - Males - Multirace
Median resident age - Males - Other Race
Median resident age - Females - White
Median resident age - Females - Black or African American
Median resident age - Females - Asian
Median resident age - Females - Hispanic or Latino
Median resident age - Females - American Indian and Alaska Native
Median resident age - Females - Multirace
Median resident age - Females - Other Race
Commute - mean travel time to work (minutes)
Travel time to work - Less than 5 minutes (%)
Travel time to work - Less than 5 minutes (% change since 2000)
Travel time to work - 5 to 9 minutes (%)
Travel time to work - 5 to 9 minutes (% change since 2000)
Travel time to work - 10 to 19 minutes (%)
Travel time to work - 10 to 19 minutes (% change since 2000)
Travel time to work - 20 to 29 minutes (%)
Travel time to work - 20 to 29 minutes (% change since 2000)
Travel time to work - 30 to 39 minutes (%)
Travel time to work - 30 to 39 minutes (% change since 2000)
Travel time to work - 40 to 59 minutes (%)
Travel time to work - 40 to 59 minutes (% change since 2000)
Travel time to work - 60 to 89 minutes (%)
Travel time to work - 60 to 89 minutes (% change since 2000)
Travel time to work - 90 or more minutes (%)
Travel time to work - 90 or more minutes (% change since 2000)
Marital status - Never married (%)
Marital status - Now married (%)
Marital status - Separated (%)
Marital status - Widowed (%)
Marital status - Divorced (%)
Median family income ($)
Median family income (% change since 2000)
Median non-family income ($)
Median non-family income (% change since 2000)
Median per capita income ($)
Median per capita income (% change since 2000)
Median family income ($) - White
Median family income ($) - Black or African American
Median family income ($) - Asian
Median family income ($) - Hispanic or Latino
Median family income ($) - American Indian and Alaska Native
Median family income ($) - Multirace
Median family income ($) - Other Race
Median year house/condo built
Median year apartment built
Year house built - Built 2005 or later (%)
Year house built - Built 2000 to 2004 (%)
Year house built - Built 1990 to 1999 (%)
Year house built - Built 1980 to 1989 (%)
Year house built - Built 1970 to 1979 (%)
Year house built - Built 1960 to 1969 (%)
Year house built - Built 1950 to 1959 (%)
Year house built - Built 1940 to 1949 (%)
Year house built - Built 1939 or earlier (%)
Average household size
Household density (households per square mile)
Average household size - White
Average household size - Black or African American
Average household size - Asian
Average household size - Hispanic or Latino
Average household size - American Indian and Alaska Native
Average household size - Multirace
Average household size - Other Race
Occupied housing units (%)
Vacant housing units (%)
Owner occupied housing units (%)
Renter occupied housing units (%)
Vacancy status - For rent (%)
Vacancy status - For sale only (%)
Vacancy status - Rented or sold, not occupied (%)
Vacancy status - For seasonal, recreational, or occasional use (%)
Vacancy status - For migrant workers (%)
Vacancy status - Other vacant (%)
Residents with income below the poverty level (%)
Residents with income below 50% of the poverty level (%)
Children below poverty level (%)
Poor families by family type - Married-couple family (%)
Poor families by family type - Male, no wife present (%)
Poor families by family type - Female, no husband present (%)
Poverty status for native-born residents (%)
Poverty status for foreign-born residents (%)
Poverty among high school graduates not in families (%)
Poverty among people who did not graduate high school not in families (%)
Residents with income below the poverty level (%) - White
Residents with income below the poverty level (%) - Black or African American
Residents with income below the poverty level (%) - Asian
Residents with income below the poverty level (%) - Hispanic or Latino
Residents with income below the poverty level (%) - American Indian and Alaska Native
Residents with income below the poverty level (%) - Multirace
Residents with income below the poverty level (%) - Other Race
Air pollution - Air Quality Index (AQI)
Air pollution - CO
Air pollution - NO2
Air pollution - SO2
Air pollution - Ozone
Air pollution - PM10
Air pollution - PM25
Air pollution - Pb
Crime - Murders per 100,000 population
Crime - Rapes per 100,000 population
Crime - Robberies per 100,000 population
Crime - Assaults per 100,000 population
Crime - Burglaries per 100,000 population
Crime - Thefts per 100,000 population
Crime - Auto thefts per 100,000 population
Crime - Arson per 100,000 population
Crime - City-data.com crime index
Crime - Violent crime index
Crime - Property crime index
Crime - Murders per 100,000 population (5 year average)
Crime - Rapes per 100,000 population (5 year average)
Crime - Robberies per 100,000 population (5 year average)
Crime - Assaults per 100,000 population (5 year average)
Crime - Burglaries per 100,000 population (5 year average)
Crime - Thefts per 100,000 population (5 year average)
Crime - Auto thefts per 100,000 population (5 year average)
Crime - Arson per 100,000 population (5 year average)
Crime - City-data.com crime index (5 year average)
Crime - Violent crime index (5 year average)
Crime - Property crime index (5 year average)
1996 Presidential Elections Results (%) - Democratic Party (Clinton)
1996 Presidential Elections Results (%) - Republican Party (Dole)
1996 Presidential Elections Results (%) - Other
2000 Presidential Elections Results (%) - Democratic Party (Gore)
2000 Presidential Elections Results (%) - Republican Party (Bush)
2000 Presidential Elections Results (%) - Other
2004 Presidential Elections Results (%) - Democratic Party (Kerry)
2004 Presidential Elections Results (%) - Republican Party (Bush)
2004 Presidential Elections Results (%) - Other
2008 Presidential Elections Results (%) - Democratic Party (Obama)
2008 Presidential Elections Results (%) - Republican Party (McCain)
2008 Presidential Elections Results (%) - Other
2012 Presidential Elections Results (%) - Democratic Party (Obama)
2012 Presidential Elections Results (%) - Republican Party (Romney)
2012 Presidential Elections Results (%) - Other
2016 Presidential Elections Results (%) - Democratic Party (Clinton)
2016 Presidential Elections Results (%) - Republican Party (Trump)
2016 Presidential Elections Results (%) - Other
2020 Presidential Elections Results (%) - Democratic Party (Biden)
2020 Presidential Elections Results (%) - Republican Party (Trump)
2020 Presidential Elections Results (%) - Other
Ancestries Reported - Arab (%)
Ancestries Reported - Czech (%)
Ancestries Reported - Danish (%)
Ancestries Reported - Dutch (%)
Ancestries Reported - English (%)
Ancestries Reported - French (%)
Ancestries Reported - French Canadian (%)
Ancestries Reported - German (%)
Ancestries Reported - Greek (%)
Ancestries Reported - Hungarian (%)
Ancestries Reported - Irish (%)
Ancestries Reported - Italian (%)
Ancestries Reported - Lithuanian (%)
Ancestries Reported - Norwegian (%)
Ancestries Reported - Polish (%)
Ancestries Reported - Portuguese (%)
Ancestries Reported - Russian (%)
Ancestries Reported - Scotch-Irish (%)
Ancestries Reported - Scottish (%)
Ancestries Reported - Slovak (%)
Ancestries Reported - Subsaharan African (%)
Ancestries Reported - Swedish (%)
Ancestries Reported - Swiss (%)
Ancestries Reported - Ukrainian (%)
Ancestries Reported - United States (%)
Ancestries Reported - Welsh (%)
Ancestries Reported - West Indian (%)
Ancestries Reported - Other (%)
Educational Attainment - No schooling completed (%)
Educational Attainment - Less than high school (%)
Educational Attainment - High school or equivalent (%)
Educational Attainment - Less than 1 year of college (%)
Educational Attainment - 1 or more years of college (%)
Educational Attainment - Associate degree (%)
Educational Attainment - Bachelor's degree (%)
Educational Attainment - Master's degree (%)
Educational Attainment - Professional school degree (%)
Educational Attainment - Doctorate degree (%)
School Enrollment - Nursery, preschool (%)
School Enrollment - Kindergarten (%)
School Enrollment - Grade 1 to 4 (%)
School Enrollment - Grade 5 to 8 (%)
School Enrollment - Grade 9 to 12 (%)
School Enrollment - College undergrad (%)
School Enrollment - Graduate or professional (%)
School Enrollment - Not enrolled in school (%)
School enrollment - Public schools (%)
School enrollment - Private schools (%)
School enrollment - Not enrolled (%)
Median number of rooms in houses and condos
Median number of rooms in apartments
Housing units lacking complete plumbing facilities (%)
Housing units lacking complete kitchen facilities (%)
Density of houses
Urban houses (%)
Rural houses (%)
Households with people 60 years and over (%)
Households with people 65 years and over (%)
Households with people 75 years and over (%)
Households with one or more nonrelatives (%)
Households with no nonrelatives (%)
Population in households (%)
Family households (%)
Nonfamily households (%)
Population in families (%)
Family households with own children (%)
Median number of bedrooms in owner occupied houses
Mean number of bedrooms in owner occupied houses
Median number of bedrooms in renter occupied houses
Mean number of bedrooms in renter occupied houses
Median number of vehichles in owner occupied houses
Mean number of vehichles in owner occupied houses
Median number of vehichles in renter occupied houses
Mean number of vehichles in renter occupied houses
Mortgage status - with mortgage (%)
Mortgage status - with second mortgage (%)
Mortgage status - with home equity loan (%)
Mortgage status - with both second mortgage and home equity loan (%)
Mortgage status - without a mortgage (%)
Average family size
Average family size - White
Average family size - Black or African American
Average family size - Asian
Average family size - Hispanic or Latino
Average family size - American Indian and Alaska Native
Average family size - Multirace
Average family size - Other Race
Geographical mobility - Same house 1 year ago (%)
Geographical mobility - Moved within same county (%)
Geographical mobility - Moved from different county within same state (%)
Geographical mobility - Moved from different state (%)
Geographical mobility - Moved from abroad (%)
Place of birth - Born in state of residence (%)
Place of birth - Born in other state (%)
Place of birth - Native, outside of US (%)
Place of birth - Foreign born (%)
Housing units in structures - 1, detached (%)
Housing units in structures - 1, attached (%)
Housing units in structures - 2 (%)
Housing units in structures - 3 or 4 (%)
Housing units in structures - 5 to 9 (%)
Housing units in structures - 10 to 19 (%)
Housing units in structures - 20 to 49 (%)
Housing units in structures - 50 or more (%)
Housing units in structures - Mobile home (%)
Housing units in structures - Boat, RV, van, etc. (%)
House/condo owner moved in on average (years ago)
Renter moved in on average (years ago)
Year householder moved into unit - Moved in 1999 to March 2000 (%)
Year householder moved into unit - Moved in 1995 to 1998 (%)
Year householder moved into unit - Moved in 1990 to 1994 (%)
Year householder moved into unit - Moved in 1980 to 1989 (%)
Year householder moved into unit - Moved in 1970 to 1979 (%)
Year householder moved into unit - Moved in 1969 or earlier (%)
Means of transportation to work - Drove car alone (%)
Means of transportation to work - Carpooled (%)
Means of transportation to work - Public transportation (%)
Means of transportation to work - Bus or trolley bus (%)
Means of transportation to work - Streetcar or trolley car (%)
Means of transportation to work - Subway or elevated (%)
Means of transportation to work - Railroad (%)
Means of transportation to work - Ferryboat (%)
Means of transportation to work - Taxicab (%)
Means of transportation to work - Motorcycle (%)
Means of transportation to work - Bicycle (%)
Means of transportation to work - Walked (%)
Means of transportation to work - Other means (%)
Working at home (%)
Industry diversity
Most Common Industries - Agriculture, forestry, fishing and hunting, and mining (%)
Most Common Industries - Agriculture, forestry, fishing and hunting (%)
Most Common Industries - Mining, quarrying, and oil and gas extraction (%)
Most Common Industries - Construction (%)
Most Common Industries - Manufacturing (%)
Most Common Industries - Wholesale trade (%)
Most Common Industries - Retail trade (%)
Most Common Industries - Transportation and warehousing, and utilities (%)
Most Common Industries - Transportation and warehousing (%)
Most Common Industries - Utilities (%)
Most Common Industries - Information (%)
Most Common Industries - Finance and insurance, and real estate and rental and leasing (%)
Most Common Industries - Finance and insurance (%)
Most Common Industries - Real estate and rental and leasing (%)
Most Common Industries - Professional, scientific, and management, and administrative and waste management services (%)
Most Common Industries - Professional, scientific, and technical services (%)
Most Common Industries - Management of companies and enterprises (%)
Most Common Industries - Administrative and support and waste management services (%)
Most Common Industries - Educational services, and health care and social assistance (%)
Most Common Industries - Educational services (%)
Most Common Industries - Health care and social assistance (%)
Most Common Industries - Arts, entertainment, and recreation, and accommodation and food services (%)
Most Common Industries - Arts, entertainment, and recreation (%)
Most Common Industries - Accommodation and food services (%)
Most Common Industries - Other services, except public administration (%)
Most Common Industries - Public administration (%)
Occupation diversity
Most Common Occupations - Management, business, science, and arts occupations (%)
Most Common Occupations - Management, business, and financial occupations (%)
Most Common Occupations - Management occupations (%)
Most Common Occupations - Business and financial operations occupations (%)
Most Common Occupations - Computer, engineering, and science occupations (%)
Most Common Occupations - Computer and mathematical occupations (%)
Most Common Occupations - Architecture and engineering occupations (%)
Most Common Occupations - Life, physical, and social science occupations (%)
Most Common Occupations - Education, legal, community service, arts, and media occupations (%)
Most Common Occupations - Community and social service occupations (%)
Most Common Occupations - Legal occupations (%)
Most Common Occupations - Education, training, and library occupations (%)
Most Common Occupations - Arts, design, entertainment, sports, and media occupations (%)
Most Common Occupations - Healthcare practitioners and technical occupations (%)
Most Common Occupations - Health diagnosing and treating practitioners and other technical occupations (%)
Most Common Occupations - Health technologists and technicians (%)
Most Common Occupations - Service occupations (%)
Most Common Occupations - Healthcare support occupations (%)
Most Common Occupations - Protective service occupations (%)
Most Common Occupations - Fire fighting and prevention, and other protective service workers including supervisors (%)
Most Common Occupations - Law enforcement workers including supervisors (%)
Most Common Occupations - Food preparation and serving related occupations (%)
Most Common Occupations - Building and grounds cleaning and maintenance occupations (%)
Most Common Occupations - Personal care and service occupations (%)
Most Common Occupations - Sales and office occupations (%)
Most Common Occupations - Sales and related occupations (%)
Most Common Occupations - Office and administrative support occupations (%)
Most Common Occupations - Natural resources, construction, and maintenance occupations (%)
Most Common Occupations - Farming, fishing, and forestry occupations (%)
Most Common Occupations - Construction and extraction occupations (%)
Most Common Occupations - Installation, maintenance, and repair occupations (%)
Most Common Occupations - Production, transportation, and material moving occupations (%)
Most Common Occupations - Production occupations (%)
Most Common Occupations - Transportation occupations (%)
Most Common Occupations - Material moving occupations (%)
People in Group quarters - Institutionalized population (%)
People in Group quarters - Correctional institutions (%)
People in Group quarters - Federal prisons and detention centers (%)
People in Group quarters - Halfway houses (%)
People in Group quarters - Local jails and other confinement facilities (including police lockups) (%)
People in Group quarters - Military disciplinary barracks (%)
People in Group quarters - State prisons (%)
People in Group quarters - Other types of correctional institutions (%)
People in Group quarters - Nursing homes (%)
People in Group quarters - Hospitals/wards, hospices, and schools for the handicapped (%)
People in Group quarters - Hospitals/wards and hospices for chronically ill (%)
People in Group quarters - Hospices or homes for chronically ill (%)
People in Group quarters - Military hospitals or wards for chronically ill (%)
People in Group quarters - Other hospitals or wards for chronically ill (%)
People in Group quarters - Hospitals or wards for drug/alcohol abuse (%)
People in Group quarters - Mental (Psychiatric) hospitals or wards (%)
People in Group quarters - Schools, hospitals, or wards for the mentally retarded (%)
People in Group quarters - Schools, hospitals, or wards for the physically handicapped (%)
People in Group quarters - Institutions for the deaf (%)
People in Group quarters - Institutions for the blind (%)
People in Group quarters - Orthopedic wards and institutions for the physically handicapped (%)
People in Group quarters - Wards in general hospitals for patients who have no usual home elsewhere (%)
People in Group quarters - Wards in military hospitals for patients who have no usual home elsewhere (%)
People in Group quarters - Juvenile institutions (%)
People in Group quarters - Long-term care (%)
People in Group quarters - Homes for abused, dependent, and neglected children (%)
People in Group quarters - Residential treatment centers for emotionally disturbed children (%)
People in Group quarters - Training schools for juvenile delinquents (%)
People in Group quarters - Short-term care, detention or diagnostic centers for delinquent children (%)
People in Group quarters - Type of juvenile institution unknown (%)
People in Group quarters - Noninstitutionalized population (%)
People in Group quarters - College dormitories (includes college quarters off campus) (%)
People in Group quarters - Military quarters (%)
People in Group quarters - On base (%)
People in Group quarters - Barracks, unaccompanied personnel housing (UPH), (Enlisted/Officer), ;and similar group living quarters for military personnel (%)
People in Group quarters - Transient quarters for temporary residents (%)
People in Group quarters - Military ships (%)
People in Group quarters - Group homes (%)
People in Group quarters - Homes or halfway houses for drug/alcohol abuse (%)
People in Group quarters - Homes for the mentally ill (%)
People in Group quarters - Homes for the mentally retarded (%)
People in Group quarters - Homes for the physically handicapped (%)
People in Group quarters - Other group homes (%)
People in Group quarters - Religious group quarters (%)
People in Group quarters - Dormitories (%)
People in Group quarters - Agriculture workers' dormitories on farms (%)
People in Group quarters - Job Corps and vocational training facilities (%)
People in Group quarters - Other workers' dormitories (%)
People in Group quarters - Crews of maritime vessels (%)
People in Group quarters - Other nonhousehold living situations (%)
People in Group quarters - Other noninstitutional group quarters (%)
Residents speaking English at home (%)
Residents speaking English at home - Born in the United States (%)
Residents speaking English at home - Native, born elsewhere (%)
Residents speaking English at home - Foreign born (%)
Residents speaking Spanish at home (%)
Residents speaking Spanish at home - Born in the United States (%)
Residents speaking Spanish at home - Native, born elsewhere (%)
Residents speaking Spanish at home - Foreign born (%)
Residents speaking other language at home (%)
Residents speaking other language at home - Born in the United States (%)
Residents speaking other language at home - Native, born elsewhere (%)
Residents speaking other language at home - Foreign born (%)
Class of Workers - Employee of private company (%)
Class of Workers - Self-employed in own incorporated business (%)
Class of Workers - Private not-for-profit wage and salary workers (%)
Class of Workers - Local government workers (%)
Class of Workers - State government workers (%)
Class of Workers - Federal government workers (%)
Class of Workers - Self-employed workers in own not incorporated business and Unpaid family workers (%)
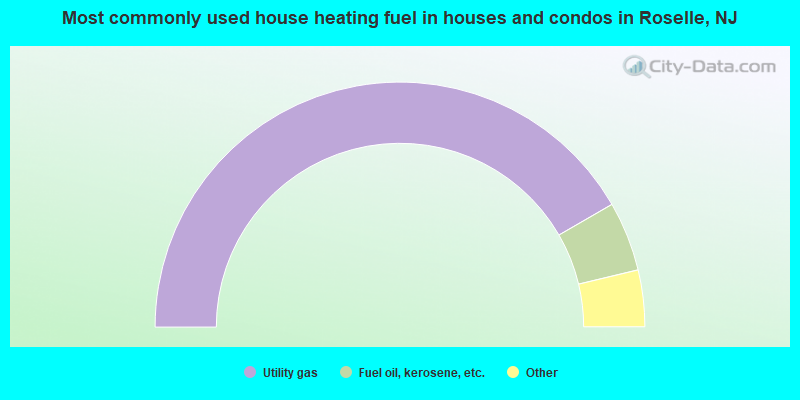
House heating fuel used in houses and condos - Utility gas (%)
House heating fuel used in houses and condos - Bottled, tank, or LP gas (%)
House heating fuel used in houses and condos - Electricity (%)
House heating fuel used in houses and condos - Fuel oil, kerosene, etc. (%)
House heating fuel used in houses and condos - Coal or coke (%)
House heating fuel used in houses and condos - Wood (%)
House heating fuel used in houses and condos - Solar energy (%)
House heating fuel used in houses and condos - Other fuel (%)
House heating fuel used in houses and condos - No fuel used (%)
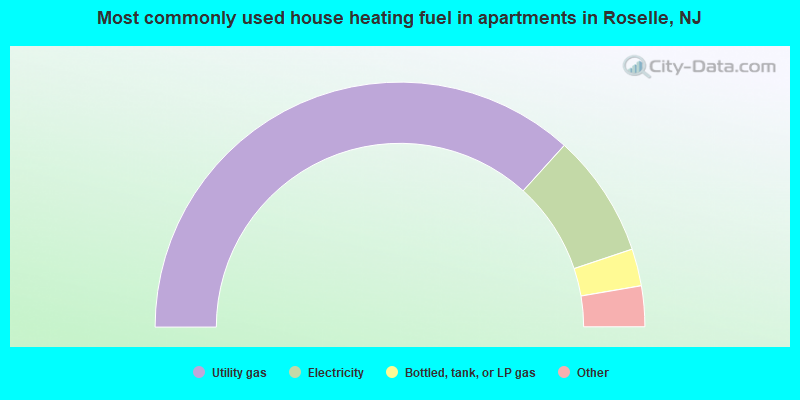
House heating fuel used in apartments - Utility gas (%)
House heating fuel used in apartments - Bottled, tank, or LP gas (%)
House heating fuel used in apartments - Electricity (%)
House heating fuel used in apartments - Fuel oil, kerosene, etc. (%)
House heating fuel used in apartments - Coal or coke (%)
House heating fuel used in apartments - Wood (%)
House heating fuel used in apartments - Solar energy (%)
House heating fuel used in apartments - Other fuel (%)
House heating fuel used in apartments - No fuel used (%)
Armed forces status - In Armed Forces (%)
Armed forces status - Civilian (%)
Armed forces status - Civilian - Veteran (%)
Armed forces status - Civilian - Nonveteran (%)
Fatal accidents locations in years 2005-2021
Fatal accidents locations in 2005
Fatal accidents locations in 2006
Fatal accidents locations in 2007
Fatal accidents locations in 2008
Fatal accidents locations in 2009
Fatal accidents locations in 2010
Fatal accidents locations in 2011
Fatal accidents locations in 2012
Fatal accidents locations in 2013
Fatal accidents locations in 2014
Fatal accidents locations in 2015
Fatal accidents locations in 2016
Fatal accidents locations in 2017
Fatal accidents locations in 2018
Fatal accidents locations in 2019
Fatal accidents locations in 2020
Fatal accidents locations in 2021
Alcohol use - People drinking some alcohol every month (%)
Alcohol use - People not drinking at all (%)
Alcohol use - Average days/month drinking alcohol
Alcohol use - Average drinks/week
Alcohol use - Average days/year people drink much
Audiometry - Average condition of hearing (%)
Audiometry - People that can hear a whisper from across a quiet room (%)
Audiometry - People that can hear normal voice from across a quiet room (%)
Audiometry - Ears ringing, roaring, buzzing (%)
Audiometry - Had a job exposure to loud noise (%)
Audiometry - Had off-work exposure to loud noise (%)
Blood Pressure & Cholesterol - Has high blood pressure (%)
Blood Pressure & Cholesterol - Checking blood pressure at home (%)
Blood Pressure & Cholesterol - Frequently checking blood cholesterol (%)
Blood Pressure & Cholesterol - Has high cholesterol level (%)
Consumer Behavior - Money monthly spent on food at supermarket/grocery store
Consumer Behavior - Money monthly spent on food at other stores
Consumer Behavior - Money monthly spent on eating out
Consumer Behavior - Money monthly spent on carryout/delivered foods
Consumer Behavior - Income spent on food at supermarket/grocery store (%)
Consumer Behavior - Income spent on food at other stores (%)
Consumer Behavior - Income spent on eating out (%)
Consumer Behavior - Income spent on carryout/delivered foods (%)
Current Health Status - General health condition (%)
Current Health Status - Blood donors (%)
Current Health Status - Has blood ever tested for HIV virus (%)
Current Health Status - Left-handed people (%)
Dermatology - People using sunscreen (%)
Diabetes - Diabetics (%)
Diabetes - Had a blood test for high blood sugar (%)
Diabetes - People taking insulin (%)
Diet Behavior & Nutrition - Diet health (%)
Diet Behavior & Nutrition - Milk product consumption (# of products/month)
Diet Behavior & Nutrition - Meals not home prepared (#/week)
Diet Behavior & Nutrition - Meals from fast food or pizza place (#/week)
Diet Behavior & Nutrition - Ready-to-eat foods (#/month)
Diet Behavior & Nutrition - Frozen meals/pizza (#/month)
Drug Use - People that ever used marijuana or hashish (%)
Drug Use - Ever used hard drugs (%)
Drug Use - Ever used any form of cocaine (%)
Drug Use - Ever used heroin (%)
Drug Use - Ever used methamphetamine (%)
Health Insurance - People covered by health insurance (%)
Kidney Conditions-Urology - Avg. # of times urinating at night
Medical Conditions - People with asthma (%)
Medical Conditions - People with anemia (%)
Medical Conditions - People with psoriasis (%)
Medical Conditions - People with overweight (%)
Medical Conditions - Elderly people having difficulties in thinking or remembering (%)
Medical Conditions - People who ever received blood transfusion (%)
Medical Conditions - People having trouble seeing even with glass/contacts (%)
Medical Conditions - People with arthritis (%)
Medical Conditions - People with gout (%)
Medical Conditions - People with congestive heart failure (%)
Medical Conditions - People with coronary heart disease (%)
Medical Conditions - People with angina pectoris (%)
Medical Conditions - People who ever had heart attack (%)
Medical Conditions - People who ever had stroke (%)
Medical Conditions - People with emphysema (%)
Medical Conditions - People with thyroid problem (%)
Medical Conditions - People with chronic bronchitis (%)
Medical Conditions - People with any liver condition (%)
Medical Conditions - People who ever had cancer or malignancy (%)
Mental Health - People who have little interest in doing things (%)
Mental Health - People feeling down, depressed, or hopeless (%)
Mental Health - People who have trouble sleeping or sleeping too much (%)
Mental Health - People feeling tired or having little energy (%)
Mental Health - People with poor appetite or overeating (%)
Mental Health - People feeling bad about themself (%)
Mental Health - People who have trouble concentrating on things (%)
Mental Health - People moving or speaking slowly or too fast (%)
Mental Health - People having thoughts they would be better off dead (%)
Oral Health - Average years since last visit a dentist
Oral Health - People embarrassed because of mouth (%)
Oral Health - People with gum disease (%)
Oral Health - General health of teeth and gums (%)
Oral Health - Average days a week using dental floss/device
Oral Health - Average days a week using mouthwash for dental problem
Oral Health - Average number of teeth
Pesticide Use - Households using pesticides to control insects (%)
Pesticide Use - Households using pesticides to kill weeds (%)
Physical Activity - People doing vigorous-intensity work activities (%)
Physical Activity - People doing moderate-intensity work activities (%)
Physical Activity - People walking or bicycling (%)
Physical Activity - People doing vigorous-intensity recreational activities (%)
Physical Activity - People doing moderate-intensity recreational activities (%)
Physical Activity - Average hours a day doing sedentary activities
Physical Activity - Average hours a day watching TV or videos
Physical Activity - Average hours a day using computer
Physical Functioning - People having limitations keeping them from working (%)
Physical Functioning - People limited in amount of work they can do (%)
Physical Functioning - People that need special equipment to walk (%)
Physical Functioning - People experiencing confusion/memory problems (%)
Physical Functioning - People requiring special healthcare equipment (%)
Prescription Medications - Average number of prescription medicines taking
Preventive Aspirin Use - Adults 40+ taking low-dose aspirin (%)
Reproductive Health - Vaginal deliveries (%)
Reproductive Health - Cesarean deliveries (%)
Reproductive Health - Deliveries resulted in a live birth (%)
Reproductive Health - Pregnancies resulted in a delivery (%)
Reproductive Health - Women breastfeeding newborns (%)
Reproductive Health - Women that had a hysterectomy (%)
Reproductive Health - Women that had both ovaries removed (%)
Reproductive Health - Women that have ever taken birth control pills (%)
Reproductive Health - Women taking birth control pills (%)
Reproductive Health - Women that have ever used Depo-Provera or injectables (%)
Reproductive Health - Women that have ever used female hormones (%)
Sexual Behavior - People 18+ that ever had sex (vaginal, anal, or oral) (%)
Sexual Behavior - Males 18+ that ever had vaginal sex with a woman (%)
Sexual Behavior - Males 18+ that ever performed oral sex on a woman (%)
Sexual Behavior - Males 18+ that ever had anal sex with a woman (%)
Sexual Behavior - Males 18+ that ever had any sex with a man (%)
Sexual Behavior - Females 18+ that ever had vaginal sex with a man (%)
Sexual Behavior - Females 18+ that ever performed oral sex on a man (%)
Sexual Behavior - Females 18+ that ever had anal sex with a man (%)
Sexual Behavior - Females 18+ that ever had any kind of sex with a woman (%)
Sexual Behavior - Average age people first had sex
Sexual Behavior - Average number of female sex partners in lifetime (males 18+)
Sexual Behavior - Average number of female vaginal sex partners in lifetime (males 18+)
Sexual Behavior - Average age people first performed oral sex on a woman (18+)
Sexual Behavior - Average number of woman performed oral sex on in lifetime (18+)
Sexual Behavior - Average number of male sex partners in lifetime (males 18+)
Sexual Behavior - Average number of male anal sex partners in lifetime (males 18+)
Sexual Behavior - Average age people first performed oral sex on a man (18+)
Sexual Behavior - Average number of male oral sex partners in lifetime (18+)
Sexual Behavior - People using protection when performing oral sex (%)
Sexual Behavior - Average number of times people have vaginal or anal sex a year
Sexual Behavior - People having sex without condom (%)
Sexual Behavior - Average number of male sex partners in lifetime (females 18+)
Sexual Behavior - Average number of male vaginal sex partners in lifetime (females 18+)
Sexual Behavior - Average number of female sex partners in lifetime (females 18+)
Sexual Behavior - Circumcised males 18+ (%)
Sleep Disorders - Average hours sleeping at night
Sleep Disorders - People that has trouble sleeping (%)
Smoking-Cigarette Use - People smoking cigarettes (%)
Taste & Smell - People 40+ having problems with smell (%)
Taste & Smell - People 40+ having problems with taste (%)
Taste & Smell - People 40+ that ever had wisdom teeth removed (%)
Taste & Smell - People 40+ that ever had tonsils teeth removed (%)
Taste & Smell - People 40+ that ever had a loss of consciousness because of a head injury (%)
Taste & Smell - People 40+ that ever had a broken nose or other serious injury to face or skull (%)
Taste & Smell - People 40+ that ever had two or more sinus infections (%)
Weight - Average height (inches)
Weight - Average weight (pounds)
Weight - Average BMI
Weight - People that are obese (%)
Weight - People that ever were obese (%)
Weight - People trying to lose weight (%)
According to our research of New Jersey and other state lists, there were 11 registered sex offenders living in Roselle, New Jersey as of May 23, 2024 . The ratio of all residents to sex offenders in Roselle is 1,974 to 1.The ratio of registered sex offenders to all residents in this city is near the state average.
Officers per 1,000 residents here:
2.43New Jersey average:
5.53
Latest news from Roselle, NJ collected exclusively by city-data.com from local newspapers, TV, and radio stations
Ancestries: Haitian (10.2%), American (3.0%), African (2.8%), Jamaican (2.4%), Brazilian (2.0%), Italian (2.0%).
Current Local Time:
Land area: 2.64 square miles.
Population density: 8,447 people per square mile (high).
7,327 residents are foreign born (28.3% Latin America ).
This borough:
32.7%New Jersey:
23.2%
Median real estate property taxes paid for housing units with mortgages in 2022: $10,001 (3.1%)Median real estate property taxes paid for housing units with no mortgage in 2022: $10,001 (3.1%)
Nearest city with pop. 50,000+: Elizabeth, NJ
Nearest city with pop. 200,000+: Newark, NJ
Nearest city with pop. 1,000,000+: Brooklyn, NY
Nearest cities:
Latitude: 40.65 N, Longitude: 74.26 W
Daytime population change due to commuting: -7,679 (-34.3%)Workers who live and work in this borough: 1,283 (10.7%)
Unemployment in December 2023:
Population change in the 1990s: +1,044 (+5.2%).
Most common occupations in Roselle, NJ (%)
Both Males Females
Other office and administrative support workers, including supervisors (6.1%)
Material recording, scheduling, dispatching, and distributing workers (4.3%)
Driver/sales workers and truck drivers (4.3%)
Other production occupations, including supervisors (4.0%)
Other sales and related occupations, including supervisors (3.9%)
Laborers and material movers, hand (3.6%)
Secretaries and administrative assistants (3.6%)
Driver/sales workers and truck drivers (8.2%)
Other production occupations, including supervisors (5.5%)
Other sales and related occupations, including supervisors (5.2%)
Material recording, scheduling, dispatching, and distributing workers (4.9%)
Laborers and material movers, hand (4.8%)
Other management occupations, except farmers and farm managers (3.0%)
Building and grounds cleaning and maintenance occupations (3.0%)
Other office and administrative support workers, including supervisors (10.3%)
Secretaries and administrative assistants (6.9%)
Nursing, psychiatric, and home health aides (5.3%)
Information and record clerks, except customer service representatives (4.8%)
Customer service representatives (4.0%)
Cashiers (4.0%)
Material recording, scheduling, dispatching, and distributing workers (3.7%)
Tornado activity:
Roselle-area historical tornado activity is near New Jersey state average. It is 34% smaller than the overall U.S. average.
On 5/28/1973, a category F3 (max. wind speeds 158-206 mph) tornado 16.1 miles away from the Roselle borough center caused between $50,000 and $500,000 in damages.
On 5/28/1973, a category F3 tornado 27.6 miles away from the borough center injured 12 people and caused between $50,000 and $500,000 in damages.
Earthquake activity:
Roselle-area historical earthquake activity is significantly above New Jersey state average. It is 68% smaller than the overall U.S. average. On 8/23/2011 at 17:51:04, a magnitude 5.8 (5.8 MW, Depth: 3.7 mi, Class: Moderate, Intensity: VI - VII) earthquake occurred 273.3 miles away from Roselle center On 10/7/1983 at 10:18:46, a magnitude 5.3 (5.1 MB, 5.3 LG, 5.1 ML) earthquake occurred 228.3 miles away from the city center On 1/16/1994 at 01:49:16, a magnitude 4.6 (4.6 MB, 4.6 LG, Depth: 3.1 mi, Class: Light, Intensity: IV - V) earthquake occurred 96.1 miles away from the city center On 4/20/2002 at 10:50:47, a magnitude 5.3 (5.3 ML, Depth: 3.0 mi) earthquake occurred 268.4 miles away from the city center On 4/20/2002 at 10:50:47, a magnitude 5.2 (5.2 MB, 4.2 MS, 5.2 MW, 5.0 MW) earthquake occurred 266.6 miles away from Roselle center On 1/16/1994 at 00:42:43, a magnitude 4.2 (4.2 MB, 4.0 LG, Depth: 3.1 mi) earthquake occurred 94.6 miles away from the city center Magnitude types: regional Lg-wave magnitude (LG), body-wave magnitude (MB), local magnitude (ML), surface-wave magnitude (MS), moment magnitude (MW) Natural disasters: The number of natural disasters in Union County (27) is a lot greater than the US average (15).Major Disasters (Presidential) Declared: 17Emergencies Declared: 10Floods: 7, Hurricanes: 7, Storms: 6, Heavy Rains: 4, Snowstorms: 3, Blizzards: 2, Water Shortages: 2, Winter Storms: 2, Power Outage: 1, Tornado: 1, Wind: 1, Other: 3 (Note: some incidents may be assigned to more than one category). Hospitals and medical centers near Roselle: CORNELL HALL CARE AND REHABILITATION CENTER (Nursing Home, about 2 miles away; UNION, NJ)
CORNELL HALL CONVALESCENT CENTER (Nursing Home, about 2 miles away; UNION, NJ)
HEALTHSOUTH SPECIALTY HOSPITAL OF UNION (Hospital, about 2 miles away; UNION, NJ)
UNION HOSPITAL (Hospital, about 2 miles away; UNION, NJ)
TRINITAS SAT LINDEN (Dialysis Facility, about 2 miles away; LINDEN, NJ)
PLAZA HEALTHCARE AND REHABILITATION CENTER (Nursing Home, about 2 miles away; ELIZABETH, NJ)
RCG KENILWORTH (Dialysis Facility, about 2 miles away; KENILWORTH, NJ)
Amtrak stations near Roselle: 5 miles: NEWARK INTERNATIONAL AIRPORT (NEWARK, ) Services: ticket office, enclosed waiting area, public restrooms, public payphones.
7 miles: METROPARK (ISELIN, 100 MIDDLESEX-ESSEX TPK.) Services: ticket office, fully wheelchair accessible, enclosed waiting area, public restrooms, public payphones, paid short-term parking, call for car rental service, taxi stand, public transit connection.
8 miles: NEWARK (RAYMOND PLAZA WEST) Services: ticket office, fully wheelchair accessible, enclosed waiting area, public restrooms, public payphones, snack bar, ATM, paid short-term parking, paid long-term parking, call for car rental service, taxi stand, intercity bus service, public transit connection.
Colleges/universities with over 2000 students nearest to Roselle:
Kean University (about 3 miles; Union, NJ ; Full-time enrollment: 12,648)
Union County College (about 4 miles; Cranford, NJ ; FT enrollment: 9,148)
Seton Hall University (about 7 miles; South Orange, NJ ; FT enrollment: 7,742)
College of Staten Island CUNY (about 7 miles; Staten Island, NY ; FT enrollment: 11,684)
University of Medicine and Dentistry of New Jersey (about 8 miles; Newark, NJ ; FT enrollment: 3,210)
Essex County College (about 8 miles; Newark, NJ ; FT enrollment: 9,595)
New Jersey Institute of Technology (about 8 miles; Newark, NJ ; FT enrollment: 8,212)
Public high school in Roselle:
Private high school in Roselle: ROSELLE CATHOLIC HIGH SCHOOL Students: 469, Location: 350 RARITAN RD, Grades: 9-12)
Public elementary/middle schools in Roselle:
Private elementary/middle school in Roselle: ST JOSEPH THE CARPENTER SCHOOL Students: 257, Location: 140 E 3RD AVE, Grades: PK-8)
See full list of schools located in Roselle Library in Roselle: ROSELLE FREE PUBLIC LIBRARY Operating income: $858,899; Location: 104 W. FOURTH AVENUE; 55,284 books ; 1,277 audio materials ; 2,849 video materials ; 22 state licensed databases ; 1 other licensed databases ; 131 print serial subscriptions )
User-submitted facts and corrections:
Overlook Hosp is over 3 miles away. Union Hospital, Union, NJ is 3.1 miles.
Linden Airport is defunct.
Notable locations in Roselle: (A) , Roselle Golf Course (B) , Lorraine Station (C) , Roselle Free Public Library (D) , On Time Transport (E) , Roselle Fire Department (F) . Display/hide their locations on the map
Churches in Roselle include: (A) , Bethlehem Baptist Church (B) , Chestnut Street Community Church (C) , First Presbyterian Church (D) , Roselle United Methodist Church (E) , Saint Joseph's Roman Catholic Church (F) , Saint Luke's Episcopal Church (G) , Saint Matthew Baptist Church (H) , Second Baptist Church (I) . Display/hide their locations on the map
Park in Roselle: (1) . Display/hide its location on the map
Birthplace of: Barron Miles - Professional football player, Chris McGarry - Actor, Jamaal Hilliard - College basketball player (Lafayette Leopards), Jesse Holley - College basketball player (North Carolina Tar Heels), Jonathan Hart - College basketball player (East Carolina Pirates).
Union County has a predicted average indoor radon screening level between 2 and 4 pCi/L (pico curies per liter) - Moderate Potential Average household size: This borough:
2.8 peopleNew Jersey:
2.7 people
Percentage of family households: This borough:
68.8%Whole state:
69.3%
Percentage of households with unmarried partners: This borough:
6.6%Whole state:
5.9%
Likely homosexual households (counted as self-reported same-sex unmarried-partner households)
Lesbian couples: 0.3% of all households Gay men: 0.4% of all households
20 people in other noninstitutional facilities in 2010people in group homes intended for adults in 2010People in group quarters in Roselle in 2000:
24 people in homes for the mentally retarded
22 people in religious group quarters
2 people in other noninstitutional group quarters
Banks with branches in Roselle (2011 data):
JPMorgan Chase Bank, National Association: Roselle Branch at 700 1st Avenue, branch established on 2007/12/17. Info updated 2011/11/10: Bank assets: $1,811,678.0 mil, Deposits: $1,190,738.0 mil, headquarters in Columbus, OH, positive income , International Specialization, 5577 total offices , Holding Company: Jpmorgan Chase & Co.
Bank of America, National Association: Roselle Chestnut Street Branch at 105 East Fourth Avenue, branch established on 1906/12/24. Info updated 2009/11/18: Bank assets: $1,451,969.3 mil, Deposits: $1,077,176.8 mil, headquarters in Charlotte, NC, positive income , 5782 total offices , Holding Company: Bank Of America Corporation
Spencer Savings Bank, SLA: Roselle Branch at 220 Chestnut Street, branch established on 2002/06/01. Info updated 2011/07/21: Bank assets: $1,819.5 mil, Deposits: $1,338.8 mil, headquarters in Elmwood Park, NJ, positive income , Commercial Lending Specialization, 20 total offices
Crown Bank: Roselle Branch at 201 Chestnut St., branch established on 2007/08/06. Info updated 2011/12/21: Bank assets: $566.3 mil, Deposits: $472.6 mil, headquarters in Elizabeth, NJ, positive income , Commercial Lending Specialization, 16 total offices , Holding Company: Jjr Holding Company, Inc.
Roselle Savings Bank: at 235 Chestnut St, branch established on 1889/01/01. Info updated 2006/11/03: Bank assets: $419.2 mil, Deposits: $329.9 mil, local headquarters , positive income , Mortgage Lending Specialization, 4 total offices
TD Bank, National Association: Roselle Branch at 37 St George Avenue, branch established on 2004/11/13. Info updated 2010/10/04: Bank assets: $188,912.6 mil, Deposits: $153,149.8 mil, headquarters in Wilmington, DE, positive income , 1314 total offices , Holding Company: Toronto-Dominion Bank, The
For population 15 years and over in Roselle:
Never married: 42.1%Now married: 40.6%Separated: 3.6%Widowed: 5.3%Divorced: 8.4% For population 25 years and over in Roselle:
High school or higher: 88.1%Bachelor's degree or higher: 24.7%Graduate or professional degree: 8.5%Unemployed: 6.6%Mean travel time to work (commute): 29.4 minutes
Education Gini index (Inequality in education) Here:
12.7New Jersey average:
12.8
Religion statistics for Roselle, NJ (based on Union County data)
Religion Adherents Congregations Catholic 247,240 44 Mainline Protestant 35,313 109 Evangelical Protestant 30,123 129 Other 28,707 52 Black Protestant 7,858 38 Orthodox 5,717 10 None 181,541 -
Source: Clifford Grammich, Kirk Hadaway, Richard Houseal, Dale E.Jones, Alexei Krindatch, Richie Stanley and Richard H.Taylor. 2012. 2010 U.S.Religion Census: Religious Congregations & Membership Study. Association of Statisticians of American Religious Bodies. Jones, Dale E., et al. 2002. Congregations and Membership in the United States 2000. Nashville, TN: Glenmary Research Center. Graphs represent county-level data
Food Environment Statistics: Number of grocery stores : 155Here :
2.97 / 10,000 pop.State :
2.90 / 10,000 pop.
Number of supercenters and club stores : 2Union County :
0.04 / 10,000 pop.State :
0.06 / 10,000 pop.
Number of convenience stores (no gas) : 94This county :
1.80 / 10,000 pop.New Jersey :
1.76 / 10,000 pop.
Number of convenience stores (with gas) : 39Union County :
0.75 / 10,000 pop.State :
0.81 / 10,000 pop.
Number of full-service restaurants : 385This county :
7.38 / 10,000 pop.New Jersey :
7.15 / 10,000 pop.
Adult diabetes rate : Union County :
8.3%State :
8.3%
Adult obesity rate : Union County :
21.1%State :
23.3%
Low-income preschool obesity rate : Union County :
21.4%State :
18.0%
Health and Nutrition: Healthy diet rate : This city:
49.1%New Jersey:
50.6%
Average overall health of teeth and gums : Average BMI : This city:
29.4New Jersey:
28.5
People feeling badly about themselves : This city:
18.8%State:
20.0%
People not drinking alcohol at all : Roselle:
12.8%New Jersey:
11.1%
Average hours sleeping at night : Roselle:
6.7New Jersey:
6.8
Overweight people : Roselle:
35.6%New Jersey:
33.6%
General health condition : Roselle:
55.3%New Jersey:
56.9%
Average condition of hearing : More about Health and Nutrition of Roselle, NJ Residents
Local government employment and payroll (March 2022)
Function
Full-time employees
Monthly full-time payroll
Average yearly full-time wage
Part-time employees
Monthly part-time payroll
Police Protection - Officers
55 $520,892 $113,649 0 $0 Firefighters
31 $284,978 $110,314 0 $0 Solid Waste Management
29 $153,446 $63,495 11 $24,724 Other Government Administration
15 $104,167 $83,334 2 $852 Other and Unallocable
14 $64,286 $55,102 9 $16,399 Financial Administration
8 $33,957 $50,936 0 $0 Judicial and Legal
7 $31,365 $53,769 3 $2,488 Police - Other
7 $30,150 $51,686 24 $30,097 Local Libraries
4 $21,483 $64,449 7 $7,157 Parks and Recreation
2 $7,524 $45,144 1 $1,428 Fire - Other
1 $3,266 $39,192 0 $0
Totals for Government
173 $1,255,512 $87,088 57 $83,145
Roselle government finances - Expenditure in 2017 (per resident):
Current Operations - General - Other: $14,439,000 ($646.71)
Police Protection: $6,834,000 ($306.09)Local Fire Protection: $3,656,000 ($163.75)Central Staff Services: $1,048,000 ($46.94)Financial Administration: $862,000 ($38.61)Judicial and Legal Services: $689,000 ($30.86)Solid Waste Management: $594,000 ($26.60)Protective Inspection and Regulation - Other: $439,000 ($19.66)Parks and Recreation: $404,000 ($18.09)Health - Other: $354,000 ($15.86)Natural Resources - Other: $260,000 ($11.65)Housing and Community Development: $228,000 ($10.21)Regular Highways: $156,000 ($6.99)Total Salaries and Wages: $14,736,000 ($660.01)
Roselle government finances - Revenue in 2017 (per resident):
Charges - Other: $1,682,000 ($75.33)
Parking Facilities: $34,000 ($1.52)Parks and Recreation: $33,000 ($1.48)Federal Intergovernmental - Public Welfare: $149,000 ($6.67)
Local Intergovernmental - Public Welfare: $24,000 ($1.07)
Miscellaneous - General Revenue - Other: $571,000 ($25.57)
Fines and Forfeits: $437,000 ($19.57)Interest Earnings: $18,000 ($0.81)State Intergovernmental - Other: $2,912,000 ($130.43)
Public Welfare: $210,000 ($9.41)Tax - Property: $31,891,000 ($1428.36)
Other License: $77,000 ($3.45)Alcoholic Beverage License: $12,000 ($0.54)Occupation and Business License - Other: $8,000 ($0.36)
Roselle government finances - Debt in 2017 (per resident):
Long Term Debt - Outstanding Unspecified Public Purpose: $9,677,000 ($433.42)
Issue, Unspecified Public Purpose: $8,499,000 ($380.66)Beginning Outstanding - Unspecified Public Purpose: $1,893,000 ($84.79)Beginning Outstanding - Public Debt for Private Purpose: $1,411,000 ($63.20)Outstanding Nonguaranteed - Industrial Revenue: $1,323,000 ($59.26)Retired Unspecified Public Purpose: $715,000 ($32.02)Retired Nonguaranteed - Public Debt for Private Purpose: $88,000 ($3.94)Short Term Debt Outstanding - Beginning: $30,055,000 ($1346.13)
End of Fiscal Year: $24,423,000 ($1093.88)
Roselle government finances - Cash and Securities in 2017 (per resident):
Other Funds - Cash and Securities: $17,522,000 ($784.79)
6.55% of this county's 2021 resident taxpayers lived in other counties in 2020 ($90,395 average adjusted gross income )
Here:
6.55%New Jersey average:
6.70%
0.02% of residents moved from foreign countries ($49 average AGI )Union County:
0.02%New Jersey average:
0.01%
Top counties from which taxpayers relocated into this county between 2020 and 2021:
7.45% of this county's 2020 resident taxpayers moved to other counties in 2021 ($103,155 average adjusted gross income )
Here:
7.45%New Jersey average:
7.02%
0.01% of residents moved to foreign countries ($81 average AGI )Union County:
0.01%New Jersey average:
0.02%
Top counties to which taxpayers relocated from this county between 2020 and 2021:
Businesses in Roselle, NJ
Name Count Name Count
7-Eleven 2 Quiznos 1 ALDI 1 RadioShack 1 Burger King 1 Rite Aid 1 CVS 1 Sears 1 Curves 1 Taco Bell 1 Domino's Pizza 1 U-Haul 1 Dunkin Donuts 2 UPS 3 FedEx 1 Volkswagen 1 GNC 1 Walgreens 1 McDonald's 1 Wendy's 1
Strongest AM radio stations in Roselle:
WJDM (1530 AM; 10 kW; ELIZABETH, NJ; Owner: RADIO UNICA OF NEW YORK LICENSE CORP)
WMCA (570 AM; 50 kW; NEW YORK, NY; Owner: SALEM MEDIA OF NEW YORK, LLC)
WOR (710 AM; 50 kW; NEW YORK, NY; Owner: BUCKLEY BROADCASTING CORPORATION)
WINS (1010 AM; 50 kW; NEW YORK, NY; Owner: INFINITY BROADCASTING OPERATIONS, INC.)
WNSW (1430 AM; 5 kW; NEWARK, NJ; Owner: MULTICULTURAL RADIO BROADCASTING INC)
WEPN (1050 AM; 50 kW; NEW YORK, NY; Owner: NEW YORK AM RADIO, LLC)
WABC (770 AM; 50 kW; NEW YORK, NY; Owner: WABC-AM RADIO, INC.)
WBBR (1130 AM; 50 kW; NEW YORK, NY; Owner: BLOOMBERG COMMUNICATIONS INC.)
WADO (1280 AM; 50 kW; NEW YORK, NY; Owner: WADO-AM LICENSE CORP.)
WLIB (1190 AM; 30 kW; NEW YORK, NY; Owner: ICBC BROADCAST HOLDINGS-NY, INC.)
WNYC (820 AM; 10 kW; NEW YORK, NY; Owner: WNYC RADIO)
WQEW (1560 AM; 50 kW; NEW YORK, NY; Owner: THE NEW YORK TIMES ELECTRONIC MEDIA COMPANY)
WFAN (660 AM; 50 kW; NEW YORK, NY; Owner: INFINITY BROADCASTING OPERATIONS, INC.)
Strongest FM radio stations in Roselle:
WRKS (98.7 FM; NEW YORK, NY; Owner: EMMIS RADIO LICENSE CORP OF NEW YORK)
WKNJ-FM (90.3 FM; UNION TOWNSHIP, NJ; Owner: KEAN UNIVERSITY)
WNYC-FM (93.9 FM; NEW YORK, NY; Owner: WNYC RADIO)
WNEW (102.7 FM; NEW YORK, NY; Owner: INFINITY BROADCASTING OPERATIONS, INC.)
WPAT-FM (93.1 FM; PATERSON, NJ; Owner: WPAT LICENSING, INC.)
WSIA (88.9 FM; STATEN ISLAND, NY; Owner: THE COLLEGE OF STATEN ISLAND)
WQCD (101.9 FM; NEW YORK, NY; Owner: EMMIS RADIO LICENSE CORPORATION)
WCAA (105.9 FM; NEWARK, NJ; Owner: WADO-AM LICENSE CORP. ("WADO"))
WBAI (99.5 FM; NEW YORK, NY; Owner: PACIFICA FOUNDATION, INC.)
WBLS (107.5 FM; NEW YORK, NY; Owner: ICBC BROADCAST HOLDINGS-NY, INC.)
WLTW (106.7 FM; NEW YORK, NY; Owner: AMFM NEW YORK LICENSES, LLC)
WQXR-FM (96.3 FM; NEW YORK, NY; Owner: THE NEW YORK TIMES ELECTRONIC MEDIA COMPANY)
WSKQ-FM (97.9 FM; NEW YORK, NY; Owner: WSKQ LICENSING, INC.)
WXRK (92.3 FM; NEW YORK, NY; Owner: INFINITY BROADCASTING OPERATIONS, INC.)
WKTU (103.5 FM; LAKE SUCCESS, NY; Owner: AMFM RADIO LICENSES, LLC)
WQHT (97.1 FM; NEW YORK, NY; Owner: EMMIS LICENSE CORPORATION OF NEW YORK)
WAXQ (104.3 FM; NEW YORK, NY; Owner: AMFM NEW YORK LICENSES, LLC)
WHTZ (100.3 FM; NEWARK, NJ; Owner: AMFM RADIO LICENSES, L.L.C.)
WWPR-FM (105.1 FM; NEW YORK, NY; Owner: AMFM RADIO LICENSES, L.L.C.)
WCBS-FM (101.1 FM; NEW YORK, NY; Owner: INFINITY BROADCASTING OPERATIONS, INC.)
TV broadcast stations around Roselle:
WCBS-TV (Channel 2; NEW YORK, NY; Owner: CBS BROADCASTING INC.)
WABC-TV (Channel 7; NEW YORK, NY; Owner: AMERICAN BROADCASTING COMPANIES, INC)
WPIX (Channel 11; NEW YORK, NY; Owner: WPIX, INC.)
WWOR-TV (Channel 9; SECAUCUS, NJ; Owner: FOX TELEVISION STATIONS, INC.)
WNYW (Channel 5; NEW YORK, NY; Owner: FOX TELEVISION STATIONS, INC.)
WPXO-LP (Channel 34; EAST ORANGE, NJ; Owner: PAXSON COMMUNICATIONS LPTV, INC.)
WPXN-TV (Channel 31; NEW YORK, NY; Owner: PAXSON COMMUNICATIONS LICENSE COMPANY, LLC)
WNBC (Channel 4; NEW YORK, NY; Owner: NATIONAL BROADCASTING COMPANY, INC.)
WNET (Channel 13; NEWARK, NJ; Owner: EDUCATIONAL BROADCASTING CORPORATION)
WXTV (Channel 41; PATERSON, NJ; Owner: WXTV LICENSE PARTNERSHIP, G.P.)
WLBX-LP (Channel 22; CRANFORD, NJ; Owner: RENARD COMMUNICATIONS CORP.)
WNJU (Channel 47; LINDEN, NJ; Owner: WNJU LICENSE CORPORATION)
WFUT (Channel 68; NEWARK, NJ; Owner: UNIVISION NEW YORK LLC)
WNYE-TV (Channel 25; NEW YORK, NY; Owner: NEW YORK CITY BOARD OF EDUCATION)
WXNY-LP (Channel 32; NEW YORK, NY; Owner: ISLAND BROADCASTING COMPANY)
WKOB-LP (Channel 53; NEW YORK, NY; Owner: WKOB COMMUNICATIONS, INC.)
WEBR-CA (Channel 17; MANHATTAN, NY; Owner: K LICENSEE INC.)
WRNN-LP (Channel 57; NYACK, NY; Owner: LP NYACK LIMITED PARTNERSHIP)
W60AI (Channel 60; NEW YORK, NY; Owner: VENTANA TELEVISION, INC.)
WNXY-LP (Channel 26; NEW YORK, NY; Owner: ISLAND BROADCASTING COMPANY)
W33BS (Channel 33; DARIEN, CT; Owner: CT&T BROADCASTING, INC.)
WNYN-LP (Channel 39; NEW YORK, NY; Owner: ISLAND BROADCASTING COMPANY)
WNYX-LP (Channel 35; NEW YORK, NY; Owner: ISLAND BROADCASTING COMPANY)
WNJB (Channel 58; NEW BRUNSWICK, NJ; Owner: NEW JERSEY PUBLIC BROADCASTING AUTHORITY)
W54CZ (Channel 54; MORRISTOWN, NJ; Owner: WLNY-TV, INC.)
National Bridge Inventory (NBI) Statistics 8 Number of bridges46ft / 13.6m Total length $5,598,000 Total costs59,341 Total average daily traffic2,191 Total average daily truck traffic72,133 Total future (year 2040) average daily traffic
FCC Registered Antenna Towers: 31 (
See the full list of FCC Registered Antenna Towers in Roselle )
FCC Registered Broadcast Land Mobile Towers: 11 (
See the full list of FCC Registered Broadcast Land Mobile Towers in Roselle, NJ )
FCC Registered Microwave Towers: 6
ROSELLE, 109 Aldene Road (Lat: 40.656389 Lon: -74.281667), Type: Tank, Structure height: 27.4 m, Overall height: 33.5 m, Call Sign: WNEY756, Assigned Frequencies: 928.037 MHz, 952.037 MHz, 928.237 MHz, 952.237 MHz, Grant Date: 03/10/2009, Expiration Date: 05/12/2019, Cancellation Date: 02/19/2016, Certifier: Victor P Patrick, Registrant: Alarmnet Inc, 2 Corporate Center Drive, Mellville, NY 11747, Phone: (516) 577-5514, Fax: (631) 351-5574, Email:
NJY0512, 138 E 11th Avenue (Lat: 40.647500 Lon: -74.259444), Type: Tower, Structure height: 38.1 m, Call Sign: WQGQ934, Licensee ID: L01728370, Assigned Frequencies: 17980.0 MHz, 18060.0 MHz, Grant Date: 03/28/2007, Expiration Date: 03/28/2017, Cancellation Date: 09/10/2013, Certifier: Joseph M Sandri Jr., Registrant: Fibertower Network Services, Corp., Debtor-In-Possession, 1875 Eye Street, Nw, 5th Floor, Room 505, Washington, DC 20006, Phone: (202) 223-1028, Email:
NJY0506, 711 East First Avenue (Lat: 40.663000 Lon: -74.245028), Type: Tank, Structure height: 33.5 m, Call Sign: WQGX867, Licensee ID: L01728370, Assigned Frequencies: 19620.0 MHz, Grant Date: 05/18/2007, Expiration Date: 05/18/2017, Cancellation Date: 09/10/2013, Certifier: Joseph M Sandri Jr., Registrant: Fibertower Network Services, Corp., Debtor-In-Possession, 1875 Eye Street, Nw, 5th Floor, Room 505, Washington, DC 20006, Phone: (202) 223-1028, Email:
NJ-NNJ6831A, 138 E 11th Avenue ( 306626 ) (Lat: 40.647639 Lon: -74.259194), Type: Tower, Structure height: 37.5 m, Overall height: 40.5 m, Call Sign: WQLT526, Assigned Frequencies: 21875.0 MHz, Grant Date: 07/07/2020, Expiration Date: 04/21/2030, Cancellation Date: 09/13/2021, Certifier: Nadja S Sodos-Wallace, Registrant: T-Mobile Usa, Inc., 12920 Se 38th Street, Bellevue, WA 98006, Phone: (425) 383-8402, Fax: (425) 383-4840, Email:
NJ-NNJ5136A, 162 West First Street Ny61xc116 (Lat: 40.660361 Lon: -74.266167), Type: Pole, Structure height: 44.2 m, Call Sign: WQLT562, Assigned Frequencies: 23075.0 MHz, 23075.0 MHz, 23225.0 MHz, Grant Date: 07/07/2020, Expiration Date: 04/21/2030, Cancellation Date: 09/13/2021, Certifier: Nadja S Sodos-Wallace, Registrant: T-Mobile Usa, Inc., 12920 Se 38th Street, Bellevue, WA 98006, Phone: (425) 383-8402, Fax: (425) 383-4840, Email:
NJ-NNJ5140A, 711 East First Ave (Lat: 40.663278 Lon: -74.244611), Type: Tank, Structure height: 31.1 m, Call Sign: WQLT720, Assigned Frequencies: 21825.0 MHz, 21875.0 MHz, 21975.0 MHz, 22025.0 MHz, Grant Date: 07/08/2020, Expiration Date: 04/22/2030, Cancellation Date: 09/13/2021, Certifier: Nadja S Sodos-Wallace, Registrant: T-Mobile Usa, Inc., 12920 Se 38th Street, Bellevue, WA 98006, Phone: (425) 383-8402, Fax: (425) 383-4840, Email:
FCC Registered Amateur Radio Licenses: 26 (
See the full list of FCC Registered Amateur Radio Licenses in Roselle )
FAA Registered Aircraft: 1
Aircraft: CESSNA 172RG (Category: Land, Seats: 4, Weight: Up to 12,499 Pounds), Engine: LYCOMING O&VO-360 SER (180 HP) (Reciprocating)N-Number: 6278R, N6278R, N-6278R, Serial Number: 172RG0139, Year manufactured: 1979, Airworthiness Date: 12/03/1979, Certificate Issue Date: 07/23/2014Registrant (Individual): Jhonatan Munoz-Marin, 468 W 3rd Ave, Roselle, NJ 07203
Home Mortgage Disclosure Act Aggregated Statistics For Year 2009(Based on 5 full tracts) A) FHA, FSA/RHS & VA B) Conventional C) Refinancings D) Home Improvement Loans E) Loans on Dwellings For 5+ Families F) Non-occupant Loans on Number Average Value Number Average Value Number Average Value Number Average Value Number Average Value Number Average Value
LOANS ORIGINATED 102 $180,039 28 $139,821 205 $212,249 13 $64,846 5 $751,400 12 $147,833 APPLICATIONS APPROVED, NOT ACCEPTED 11 $168,273 5 $180,000 33 $216,152 6 $22,333 0 $0 3 $67,000 APPLICATIONS DENIED 44 $172,955 14 $145,786 205 $210,795 30 $38,567 2 $377,500 10 $126,700 APPLICATIONS WITHDRAWN 34 $178,059 8 $157,000 112 $223,268 3 $95,000 0 $0 6 $178,000 FILES CLOSED FOR INCOMPLETENESS 14 $168,071 2 $181,500 28 $235,893 0 $0 0 $0 1 $195,000
Aggregated Statistics For Year 2008(Based on 5 full tracts) A) FHA, FSA/RHS & VA B) Conventional C) Refinancings D) Home Improvement Loans E) Loans on Dwellings For 5+ Families F) Non-occupant Loans on G) Loans On Manufactured Number Average Value Number Average Value Number Average Value Number Average Value Number Average Value Number Average Value Number Average Value
LOANS ORIGINATED 60 $244,100 55 $210,309 264 $225,273 51 $63,725 4 $957,250 11 $200,364 0 $0 APPLICATIONS APPROVED, NOT ACCEPTED 10 $229,800 12 $237,000 70 $202,871 24 $82,958 0 $0 7 $166,000 1 $246,000 APPLICATIONS DENIED 28 $220,643 40 $224,775 326 $234,184 117 $58,496 0 $0 20 $184,700 1 $60,000 APPLICATIONS WITHDRAWN 18 $227,722 14 $217,071 119 $235,950 5 $114,200 1 $430,000 3 $187,000 0 $0 FILES CLOSED FOR INCOMPLETENESS 7 $210,143 3 $170,000 31 $253,452 3 $97,333 1 $209,000 0 $0 0 $0
Aggregated Statistics For Year 2007(Based on 5 full tracts) A) FHA, FSA/RHS & VA B) Conventional C) Refinancings D) Home Improvement Loans E) Loans on Dwellings For 5+ Families F) Non-occupant Loans on G) Loans On Manufactured Number Average Value Number Average Value Number Average Value Number Average Value Number Average Value Number Average Value Number Average Value
LOANS ORIGINATED 25 $272,880 206 $220,718 565 $220,577 109 $76,624 5 $1,369,000 31 $211,032 0 $0 APPLICATIONS APPROVED, NOT ACCEPTED 2 $312,500 43 $196,465 175 $223,080 47 $44,787 0 $0 13 $236,308 1 $200,000 APPLICATIONS DENIED 11 $267,182 138 $242,855 600 $239,268 201 $81,547 1 $257,000 26 $195,192 2 $43,000 APPLICATIONS WITHDRAWN 11 $274,273 43 $234,581 267 $226,674 27 $88,593 2 $455,000 8 $283,625 0 $0 FILES CLOSED FOR INCOMPLETENESS 0 $0 19 $231,368 81 $253,407 3 $166,667 0 $0 1 $204,000 0 $0
Aggregated Statistics For Year 2006(Based on 5 full tracts) A) FHA, FSA/RHS & VA B) Conventional C) Refinancings D) Home Improvement Loans E) Loans on Dwellings For 5+ Families F) Non-occupant Loans on G) Loans On Manufactured Number Average Value Number Average Value Number Average Value Number Average Value Number Average Value Number Average Value Number Average Value
LOANS ORIGINATED 24 $271,458 525 $185,680 826 $207,938 136 $90,779 3 $830,333 64 $222,141 0 $0 APPLICATIONS APPROVED, NOT ACCEPTED 5 $250,200 103 $197,252 197 $172,893 55 $49,982 0 $0 11 $223,000 0 $0 APPLICATIONS DENIED 4 $312,250 279 $195,541 572 $215,449 174 $57,276 2 $1,500,000 40 $192,950 1 $35,000 APPLICATIONS WITHDRAWN 4 $297,500 141 $194,362 353 $213,606 33 $136,030 1 $450,000 24 $200,708 2 $120,000 FILES CLOSED FOR INCOMPLETENESS 2 $192,000 30 $217,733 129 $241,581 6 $168,667 0 $0 6 $243,833 1 $285,000
Aggregated Statistics For Year 2005(Based on 5 full tracts) A) FHA, FSA/RHS & VA B) Conventional C) Refinancings D) Home Improvement Loans E) Loans on Dwellings For 5+ Families F) Non-occupant Loans on G) Loans On Manufactured Number Average Value Number Average Value Number Average Value Number Average Value Number Average Value Number Average Value Number Average Value
LOANS ORIGINATED 27 $249,370 529 $180,248 891 $193,209 129 $90,729 4 $717,000 79 $171,481 0 $0 APPLICATIONS APPROVED, NOT ACCEPTED 3 $176,667 80 $212,862 182 $184,863 40 $54,675 3 $600,000 9 $192,667 0 $0 APPLICATIONS DENIED 7 $263,429 246 $168,358 609 $198,468 179 $59,642 1 $225,000 29 $199,517 1 $135,000 APPLICATIONS WITHDRAWN 9 $178,556 167 $184,731 523 $195,866 52 $206,250 0 $0 35 $179,971 0 $0 FILES CLOSED FOR INCOMPLETENESS 0 $0 34 $184,088 82 $212,073 4 $102,500 0 $0 1 $330,000 0 $0
Aggregated Statistics For Year 2004(Based on 5 full tracts) A) FHA, FSA/RHS & VA B) Conventional C) Refinancings D) Home Improvement Loans E) Loans on Dwellings For 5+ Families F) Non-occupant Loans on G) Loans On Manufactured Number Average Value Number Average Value Number Average Value Number Average Value Number Average Value Number Average Value Number Average Value
LOANS ORIGINATED 75 $221,347 399 $178,634 746 $164,538 101 $68,020 8 $730,000 59 $162,017 2 $97,500 APPLICATIONS APPROVED, NOT ACCEPTED 14 $200,714 84 $177,738 170 $148,441 17 $75,588 1 $145,000 15 $157,333 0 $0 APPLICATIONS DENIED 18 $232,778 117 $171,513 486 $165,685 159 $55,214 1 $52,000 21 $146,476 1 $195,000 APPLICATIONS WITHDRAWN 24 $205,792 75 $173,293 284 $167,176 39 $122,974 1 $350,000 13 $216,923 1 $155,000 FILES CLOSED FOR INCOMPLETENESS 1 $280,000 17 $187,000 46 $175,913 6 $59,500 0 $0 2 $245,000 0 $0
Aggregated Statistics For Year 2003(Based on 5 full tracts) A) FHA, FSA/RHS & VA B) Conventional C) Refinancings D) Home Improvement Loans E) Loans on Dwellings For 5+ Families F) Non-occupant Loans on Number Average Value Number Average Value Number Average Value Number Average Value Number Average Value Number Average Value
LOANS ORIGINATED 127 $185,047 264 $165,348 1,035 $138,030 66 $36,318 7 $1,038,571 51 $122,529 APPLICATIONS APPROVED, NOT ACCEPTED 12 $158,583 55 $163,436 212 $132,778 29 $37,276 0 $0 13 $133,385 APPLICATIONS DENIED 16 $181,125 66 $166,212 552 $146,774 134 $33,269 0 $0 23 $154,870 APPLICATIONS WITHDRAWN 18 $184,889 51 $160,412 281 $147,954 20 $54,950 0 $0 5 $138,000 FILES CLOSED FOR INCOMPLETENESS 3 $186,333 15 $178,333 52 $134,385 4 $22,000 0 $0 3 $202,667
Aggregated Statistics For Year 2002(Based on 5 full tracts) A) FHA, FSA/RHS & VA B) Conventional C) Refinancings D) Home Improvement Loans E) Loans on Dwellings For 5+ Families F) Non-occupant Loans on Number Average Value Number Average Value Number Average Value Number Average Value Number Average Value Number Average Value
LOANS ORIGINATED 133 $161,436 209 $143,536 645 $119,984 128 $27,023 5 $356,800 28 $133,107 APPLICATIONS APPROVED, NOT ACCEPTED 21 $141,810 41 $133,951 152 $102,704 50 $20,520 0 $0 7 $124,143 APPLICATIONS DENIED 20 $164,200 56 $146,679 455 $106,958 131 $18,626 0 $0 9 $126,778 APPLICATIONS WITHDRAWN 21 $172,048 25 $143,200 255 $124,122 22 $39,136 0 $0 3 $147,333 FILES CLOSED FOR INCOMPLETENESS 6 $175,000 8 $154,250 59 $119,797 2 $31,500 0 $0 4 $109,250
Aggregated Statistics For Year 2001(Based on 5 full tracts) A) FHA, FSA/RHS & VA B) Conventional C) Refinancings D) Home Improvement Loans E) Loans on Dwellings For 5+ Families F) Non-occupant Loans on Number Average Value Number Average Value Number Average Value Number Average Value Number Average Value Number Average Value
LOANS ORIGINATED 135 $138,237 165 $120,327 387 $114,362 79 $21,949 7 $1,563,286 23 $102,652 APPLICATIONS APPROVED, NOT ACCEPTED 12 $138,417 22 $114,409 106 $90,896 36 $24,417 0 $0 6 $99,500 APPLICATIONS DENIED 26 $149,538 40 $123,400 390 $95,379 150 $20,313 0 $0 16 $50,312 APPLICATIONS WITHDRAWN 22 $143,409 17 $125,529 196 $112,974 24 $23,292 0 $0 8 $123,375 FILES CLOSED FOR INCOMPLETENESS 5 $126,400 3 $120,000 52 $118,462 6 $27,500 0 $0 0 $0
Aggregated Statistics For Year 2000(Based on 5 full tracts) A) FHA, FSA/RHS & VA B) Conventional C) Refinancings D) Home Improvement Loans E) Loans on Dwellings For 5+ Families F) Non-occupant Loans on Number Average Value Number Average Value Number Average Value Number Average Value Number Average Value Number Average Value
LOANS ORIGINATED 129 $128,636 173 $98,416 181 $92,624 63 $21,032 2 $4,246,000 26 $90,962 APPLICATIONS APPROVED, NOT ACCEPTED 15 $117,600 33 $102,818 88 $97,716 55 $20,927 1 $856,000 2 $53,500 APPLICATIONS DENIED 32 $132,156 67 $95,582 306 $80,487 192 $18,391 4 $334,500 14 $95,571 APPLICATIONS WITHDRAWN 30 $127,767 34 $92,176 131 $254,328 17 $23,176 1 $134,000 9 $86,444 FILES CLOSED FOR INCOMPLETENESS 4 $122,500 6 $128,500 56 $107,036 1 $15,000 0 $0 0 $0
Aggregated Statistics For Year 1999(Based on 5 full tracts) A) FHA, FSA/RHS & VA B) Conventional C) Refinancings D) Home Improvement Loans E) Loans on Dwellings For 5+ Families F) Non-occupant Loans on Number Average Value Number Average Value Number Average Value Number Average Value Number Average Value Number Average Value
LOANS ORIGINATED 185 $117,377 106 $104,880 253 $94,123 79 $20,642 2 $839,280 18 $94,853 APPLICATIONS APPROVED, NOT ACCEPTED 12 $123,383 20 $92,080 135 $96,172 40 $22,960 2 $171,600 7 $79,126 APPLICATIONS DENIED 29 $121,920 49 $104,687 332 $87,012 162 $23,158 0 $0 12 $90,887 APPLICATIONS WITHDRAWN 25 $121,099 27 $100,097 172 $89,483 23 $28,324 2 $803,000 15 $152,806 FILES CLOSED FOR INCOMPLETENESS 2 $81,975 8 $83,126 56 $98,982 2 $63,895 0 $0 3 $101,483
Detailed HMDA statistics for the following Tracts:
0340.00
, 0341.00 , 0342.00 , 0343.00 , 0344.00
Private Mortgage Insurance Companies Aggregated Statistics For Year 2009(Based on 5 full tracts) A) Conventional B) Refinancings C) Non-occupant Loans on Number Average Value Number Average Value Number Average Value
LOANS ORIGINATED 6 $178,000 2 $204,500 0 $0 APPLICATIONS APPROVED, NOT ACCEPTED 5 $233,800 6 $273,667 1 $248,000 APPLICATIONS DENIED 1 $135,000 2 $170,000 0 $0 APPLICATIONS WITHDRAWN 3 $171,333 0 $0 0 $0 FILES CLOSED FOR INCOMPLETENESS 0 $0 2 $254,500 0 $0
Aggregated Statistics For Year 2008(Based on 5 full tracts) A) Conventional B) Refinancings C) Non-occupant Loans on Number Average Value Number Average Value Number Average Value
LOANS ORIGINATED 41 $236,341 24 $269,750 1 $230,000 APPLICATIONS APPROVED, NOT ACCEPTED 25 $289,680 26 $305,192 1 $234,000 APPLICATIONS DENIED 6 $280,000 2 $358,500 3 $246,667 APPLICATIONS WITHDRAWN 4 $266,250 2 $264,500 0 $0 FILES CLOSED FOR INCOMPLETENESS 0 $0 0 $0 0 $0
Aggregated Statistics For Year 2007(Based on 5 full tracts) A) Conventional B) Refinancings C) Non-occupant Loans on Number Average Value Number Average Value Number Average Value
LOANS ORIGINATED 76 $263,171 65 $310,308 2 $293,000 APPLICATIONS APPROVED, NOT ACCEPTED 13 $249,385 27 $317,889 1 $340,000 APPLICATIONS DENIED 1 $270,000 3 $286,333 0 $0 APPLICATIONS WITHDRAWN 10 $281,900 9 $306,444 3 $336,667 FILES CLOSED FOR INCOMPLETENESS 1 $264,000 0 $0 0 $0
Aggregated Statistics For Year 2006(Based on 5 full tracts) A) Conventional B) Refinancings C) Non-occupant Loans on Number Average Value Number Average Value Number Average Value
LOANS ORIGINATED 45 $249,089 25 $291,160 1 $286,000 APPLICATIONS APPROVED, NOT ACCEPTED 12 $263,333 12 $295,583 0 $0 APPLICATIONS DENIED 0 $0 3 $322,667 1 $285,000 APPLICATIONS WITHDRAWN 6 $213,500 3 $259,333 1 $180,000 FILES CLOSED FOR INCOMPLETENESS 1 $255,000 0 $0 0 $0
Aggregated Statistics For Year 2005(Based on 5 full tracts) A) Conventional B) Refinancings C) Non-occupant Loans on Number Average Value Number Average Value Number Average Value
LOANS ORIGINATED 80 $229,138 32 $244,500 5 $191,400 APPLICATIONS APPROVED, NOT ACCEPTED 14 $224,286 24 $227,083 0 $0 APPLICATIONS DENIED 1 $266,000 1 $341,000 0 $0 APPLICATIONS WITHDRAWN 12 $283,667 9 $248,889 1 $248,000 FILES CLOSED FOR INCOMPLETENESS 2 $238,000 0 $0 0 $0
Aggregated Statistics For Year 2004(Based on 5 full tracts) A) Conventional B) Refinancings C) Non-occupant Loans on Number Average Value Number Average Value Number Average Value
LOANS ORIGINATED 112 $201,589 34 $207,706 4 $143,500 APPLICATIONS APPROVED, NOT ACCEPTED 24 $228,750 15 $189,600 2 $155,500 APPLICATIONS DENIED 6 $378,500 3 $228,667 2 $306,500 APPLICATIONS WITHDRAWN 8 $226,375 2 $199,500 1 $260,000 FILES CLOSED FOR INCOMPLETENESS 2 $219,500 0 $0 0 $0
Aggregated Statistics For Year 2003(Based on 5 full tracts) A) Conventional B) Refinancings C) Non-occupant Loans on Number Average Value Number Average Value Number Average Value
LOANS ORIGINATED 160 $181,144 62 $163,113 8 $150,250 APPLICATIONS APPROVED, NOT ACCEPTED 29 $178,966 21 $165,238 0 $0 APPLICATIONS DENIED 4 $220,750 1 $180,000 1 $304,000 APPLICATIONS WITHDRAWN 7 $179,000 7 $170,286 1 $162,000 FILES CLOSED FOR INCOMPLETENESS 0 $0 0 $0 0 $0
Aggregated Statistics For Year 2002(Based on 5 full tracts) A) Conventional B) Refinancings C) Non-occupant Loans on Number Average Value Number Average Value Number Average Value
LOANS ORIGINATED 118 $153,102 46 $157,717 6 $141,333 APPLICATIONS APPROVED, NOT ACCEPTED 26 $157,000 21 $150,714 5 $137,400 APPLICATIONS DENIED 1 $150,000 4 $134,750 1 $123,000 APPLICATIONS WITHDRAWN 7 $178,571 6 $148,167 1 $150,000 FILES CLOSED FOR INCOMPLETENESS 1 $138,000 1 $147,000 0 $0
Aggregated Statistics For Year 2001(Based on 5 full tracts) A) Conventional B) Refinancings C) Non-occupant Loans on Number Average Value Number Average Value Number Average Value
LOANS ORIGINATED 92 $126,674 19 $135,684 7 $78,429 APPLICATIONS APPROVED, NOT ACCEPTED 22 $132,364 7 $154,000 2 $158,500 APPLICATIONS DENIED 1 $167,000 4 $147,250 0 $0 APPLICATIONS WITHDRAWN 2 $85,000 1 $158,000 1 $77,000 FILES CLOSED FOR INCOMPLETENESS 0 $0 0 $0 0 $0
Aggregated Statistics For Year 2000(Based on 5 full tracts) A) Conventional B) Refinancings C) Non-occupant Loans on Number Average Value Number Average Value Number Average Value
LOANS ORIGINATED 97 $105,423 17 $132,412 7 $107,571 APPLICATIONS APPROVED, NOT ACCEPTED 12 $122,417 4 $136,250 1 $81,000 APPLICATIONS DENIED 5 $129,600 2 $133,500 1 $234,000 APPLICATIONS WITHDRAWN 1 $64,000 0 $0 0 $0 FILES CLOSED FOR INCOMPLETENESS 2 $112,500 1 $190,000 0 $0
Aggregated Statistics For Year 1999(Based on 5 full tracts) A) Conventional B) Refinancings C) Non-occupant Loans on Number Average Value Number Average Value Number Average Value
LOANS ORIGINATED 42 $108,986 26 $113,266 2 $92,410 APPLICATIONS APPROVED, NOT ACCEPTED 12 $95,102 11 $123,646 2 $128,485 APPLICATIONS DENIED 4 $126,068 0 $0 0 $0 APPLICATIONS WITHDRAWN 3 $120,503 0 $0 0 $0 FILES CLOSED FOR INCOMPLETENESS 2 $94,900 0 $0 0 $0
Detailed PMIC statistics for the following Tracts:
0340.00
, 0341.00 , 0342.00 , 0343.00 , 0344.00 Roselle compared to New Jersey state average:
Unemployed percentage below state average. Black race population percentage significantly above state average. Median age below state average.
#23 on the list of "Top 101 cities with largest percentage of females in occupations: community and social service occupations (population 5,000+)"
#51 on the list of "Top 101 cities with the most residents born in Haiti (population 500+)"
#61 on the list of "Top 101 cities with largest percentage of males in industries: transportation and warehousing (population 5,000+)"
#78 on the list of "Top 101 cities with the most residents born in Barbados (population 500+)"
#97 on the list of "Top 101 cities with largest percentage of males in occupations: transportation occupations (population 5,000+)"
#98 (07203) on the list of "Top 101 zip codes with the largest percentage of West Indian first ancestries (pop 5,000+)"
#15 on the list of "Top 101 counties with the lowest percentage of residents that keep firearms around their homes"
#17 on the list of "Top 101 counties with the largest decrease in the number of deaths per 1000 residents 2000-2006 to 2007-2013 (pop. 50,000+)"
#47 on the list of "Top 101 counties with the most Orthodox adherents"
#53 on the list of "Top 101 counties with the most Catholic adherents"
#58 on the list of "Top 101 counties with the lowest percentage of residents that drank alcohol in the past 30 days"
Top Patent Applicants
Wilfredo Ganuza (5)
Michael B. Gutierrez (3)
Ralph T. Mosley (2)
Anthony Esposito (2)
Eden Variety Products, Llc (1)
John Pelesko (1)
Ralph Mosley (1)
John Pabst, Jr. (1)
Jorge Villegas (1)
Jean Adam (1)
Total of 20 patent applications in 2008-2024.

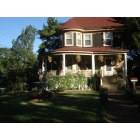
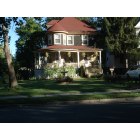
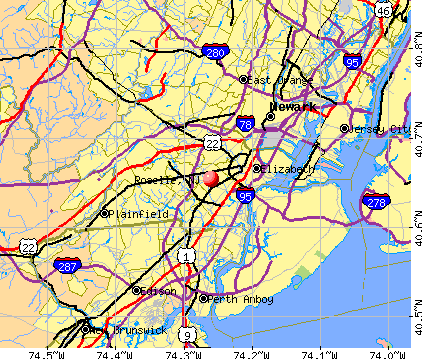


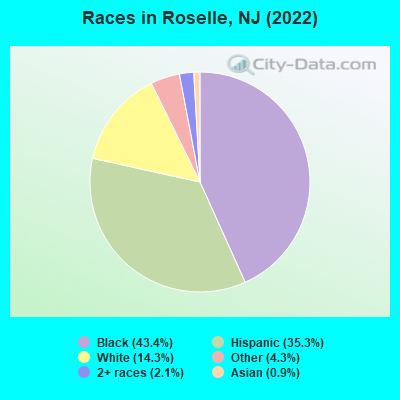
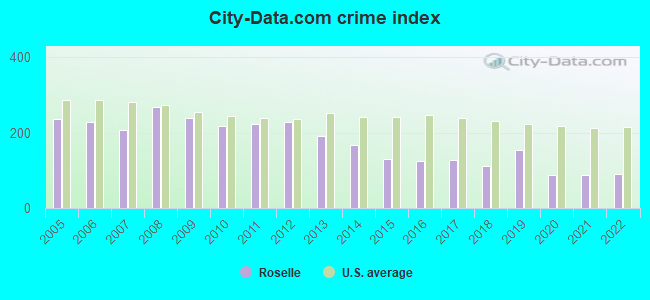
 Recent articles from our blog. Our writers, many of them Ph.D. graduates or candidates, create easy-to-read articles on a wide variety of topics.

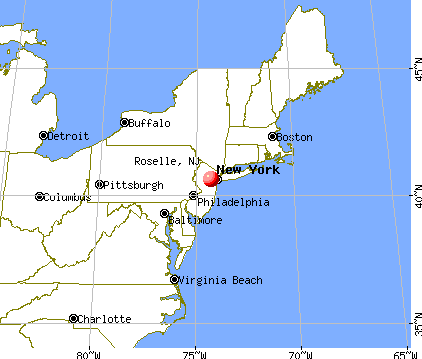
 (2.8 miles
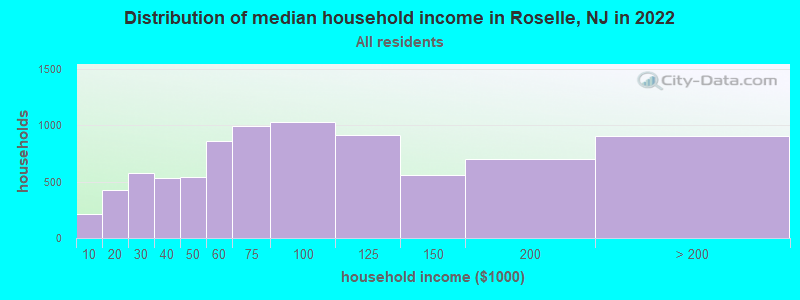
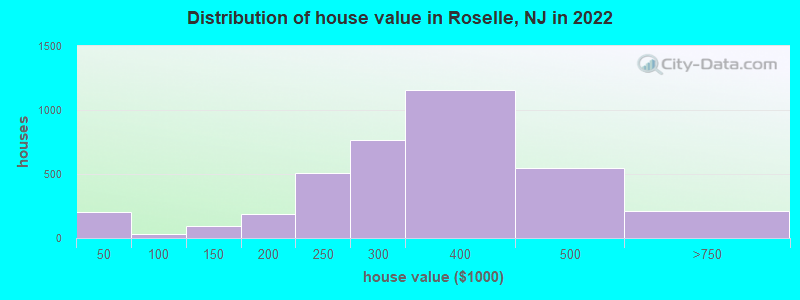
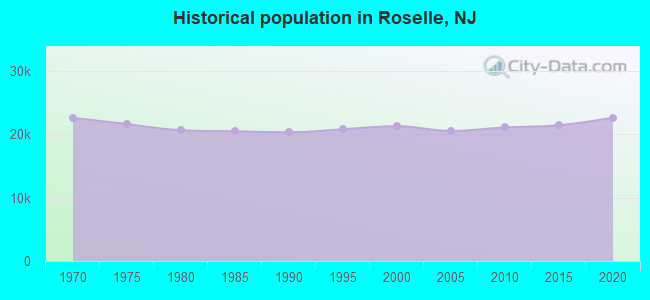
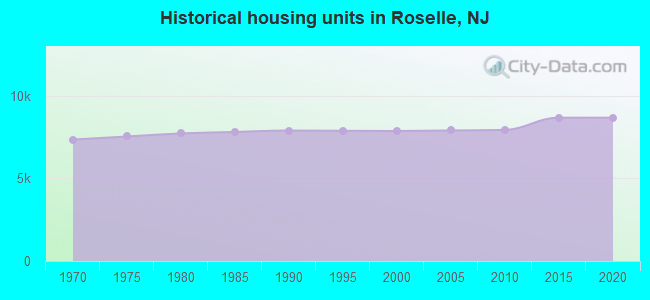
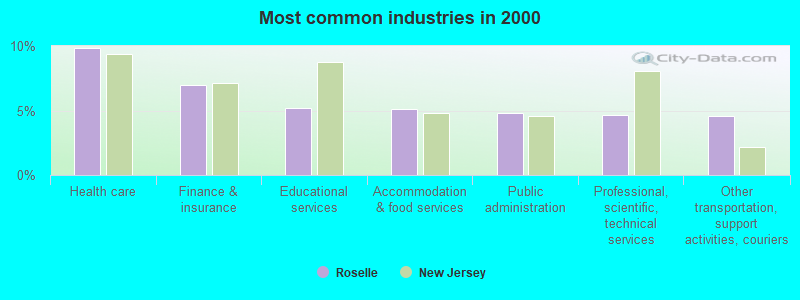
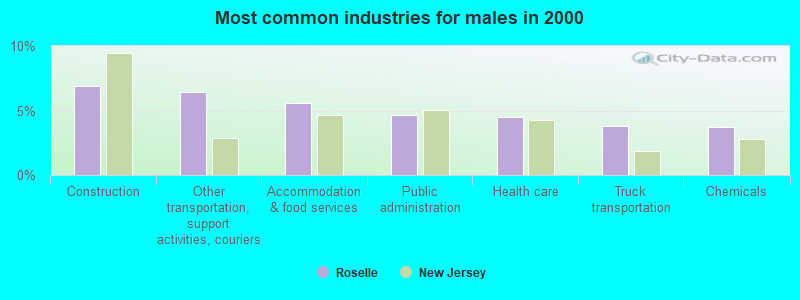
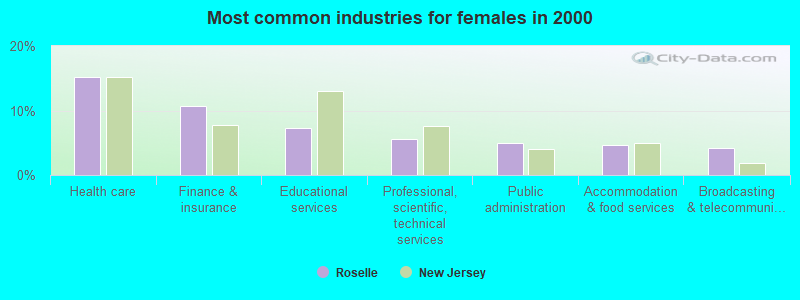
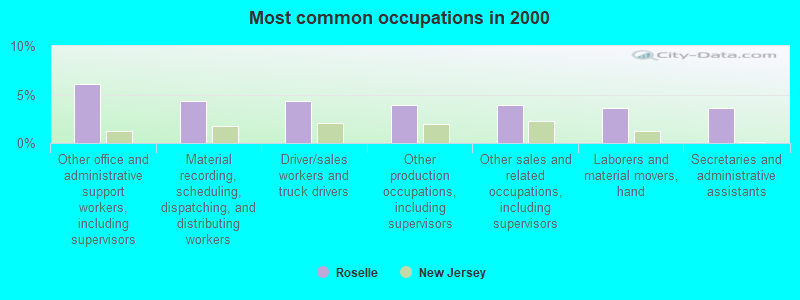
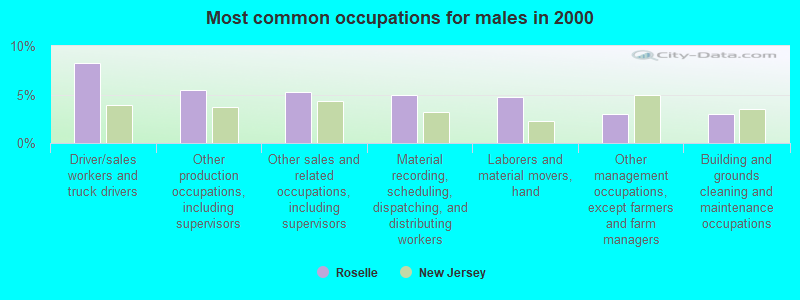
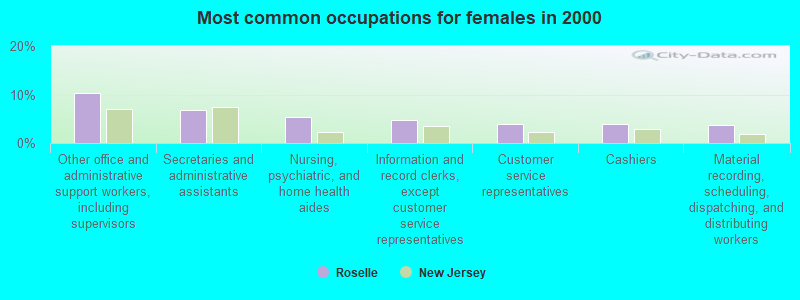
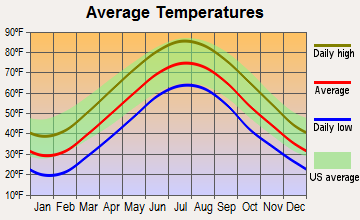
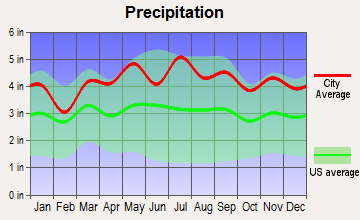
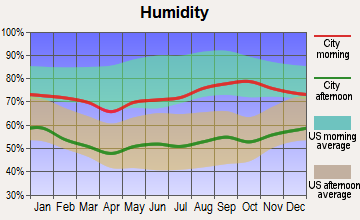
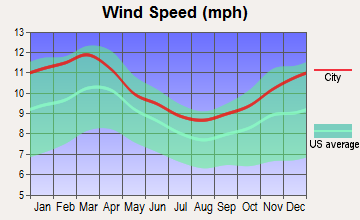
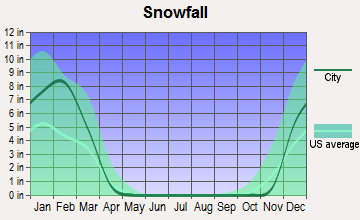
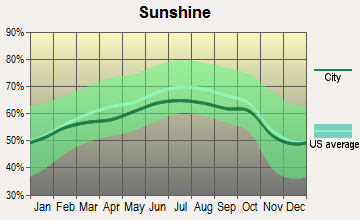
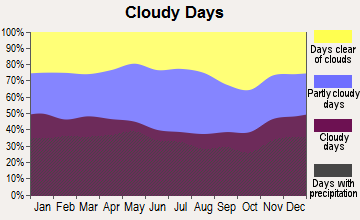
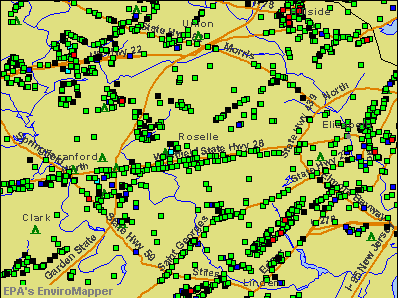

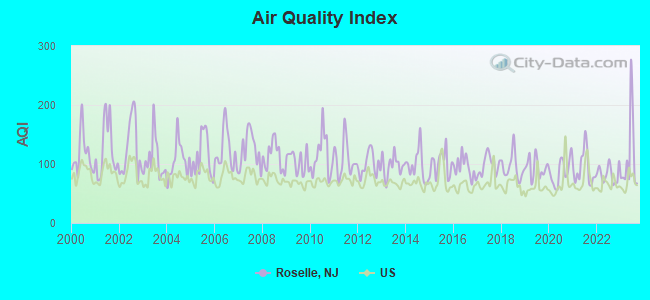
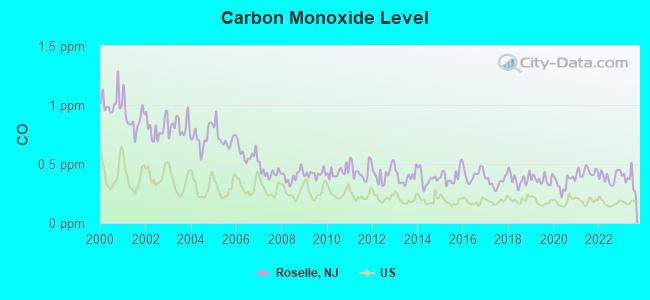
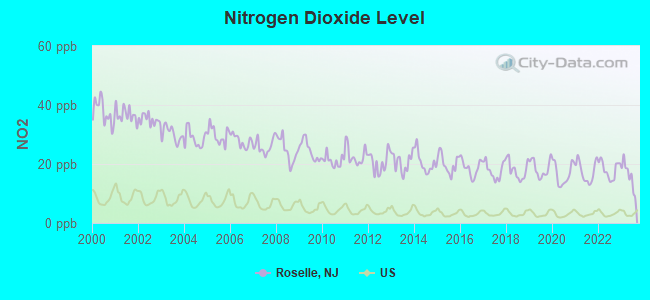
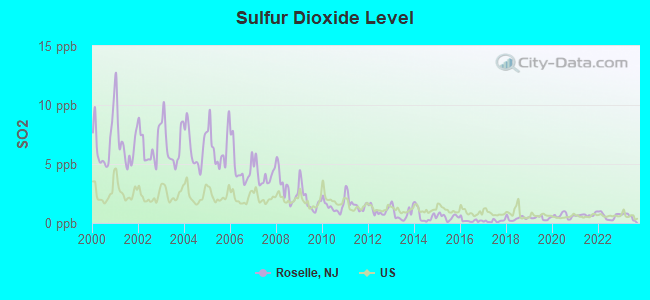
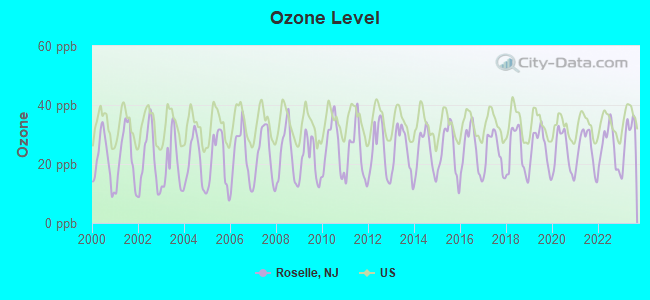
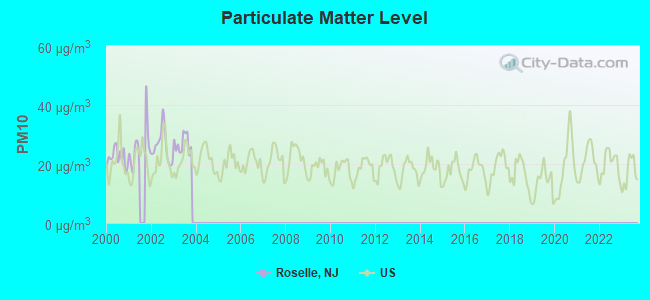
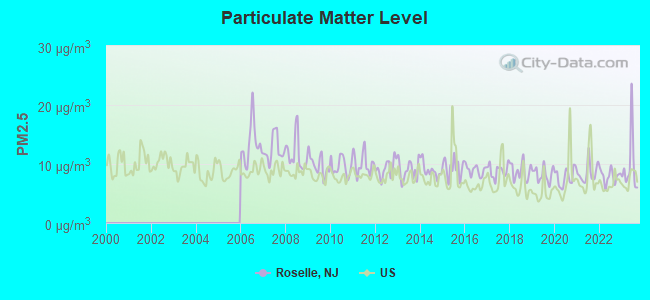
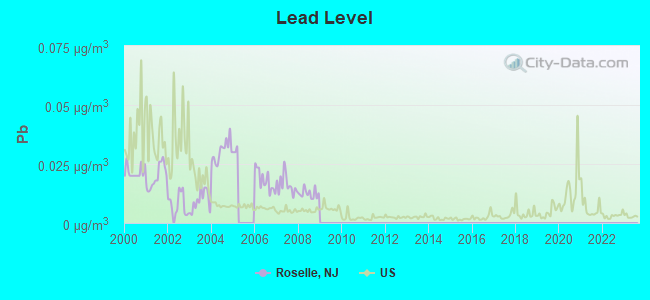

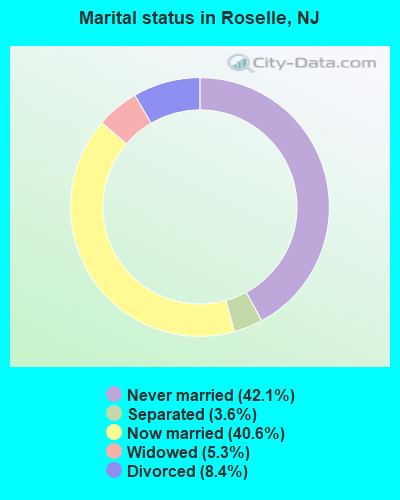
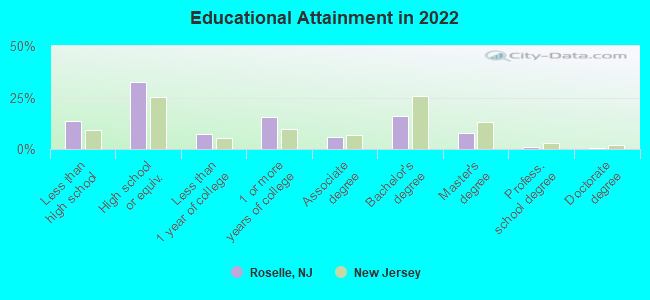
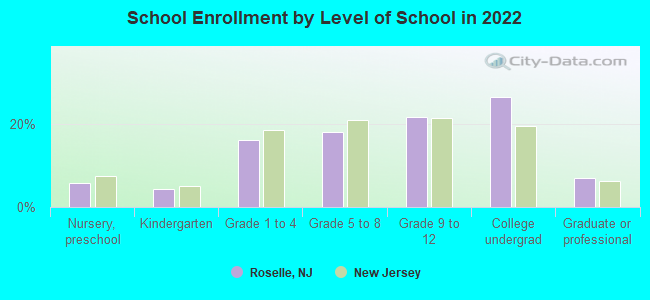
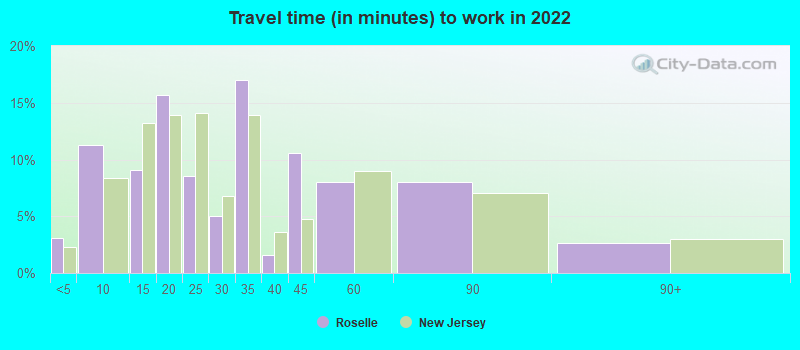
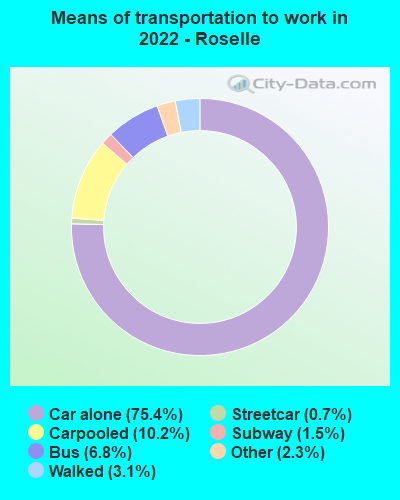
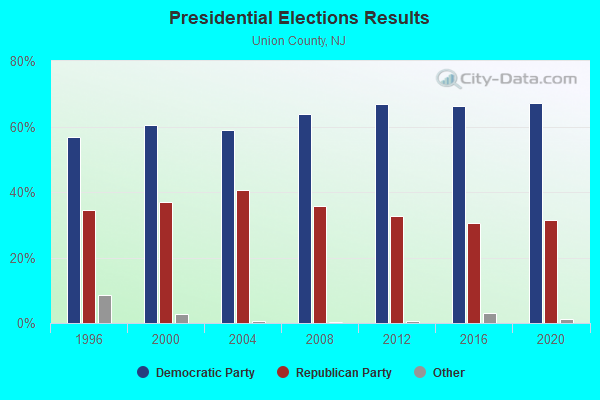
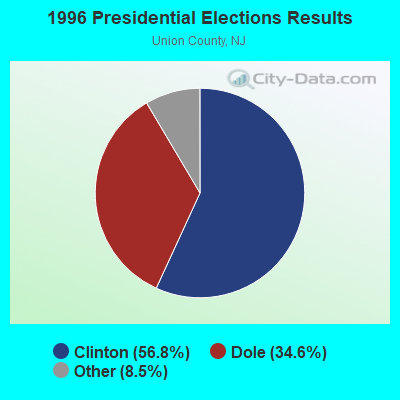
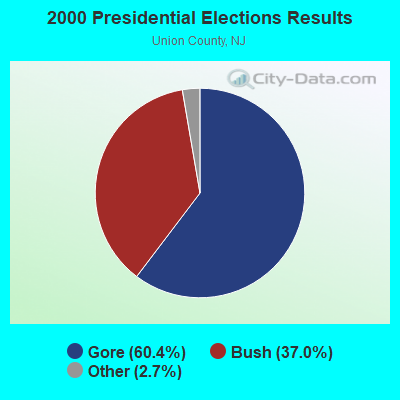
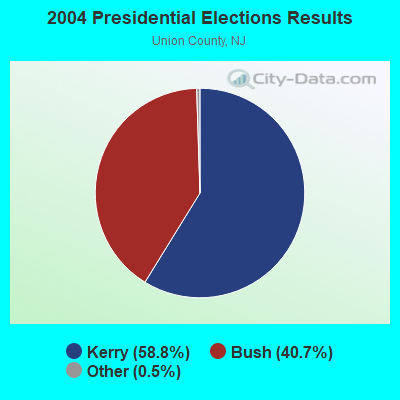
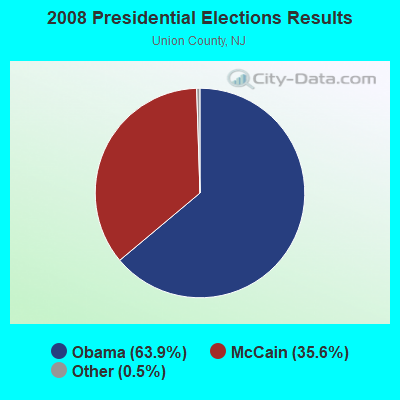
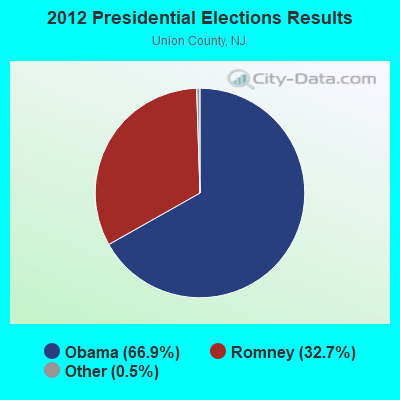
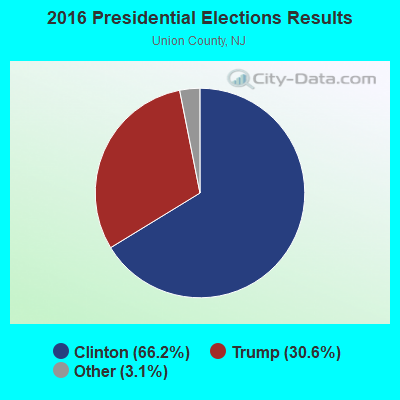

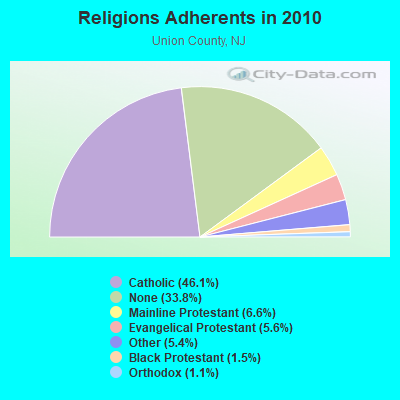
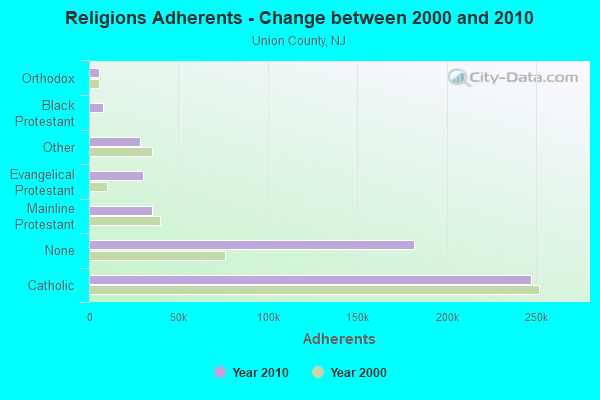
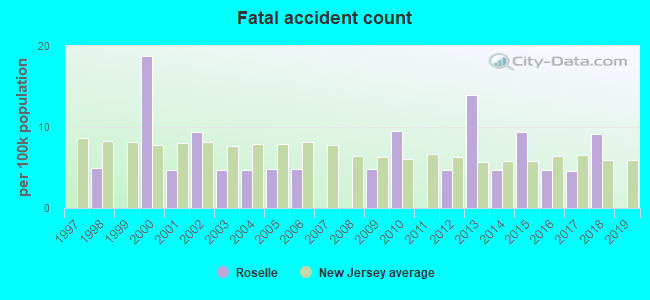
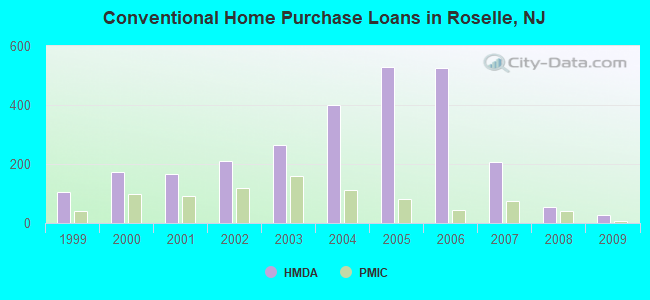
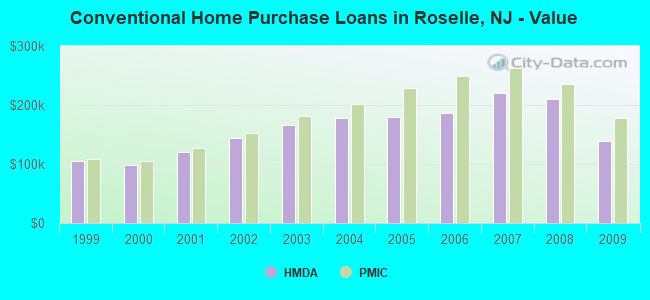
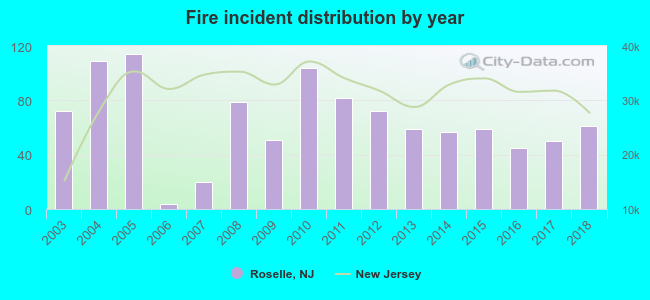 Based on the data from the years 2003 - 2018 the average number of fires per year is 65. The highest number of reported fires - 114 took place in 2005, and the least - 4 in 2006. The data has a decreasing trend.
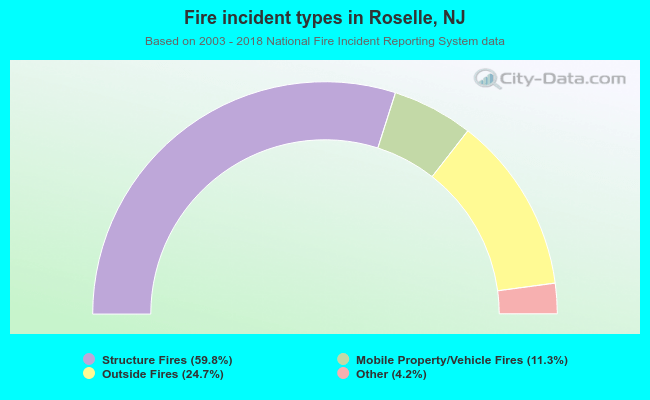 When looking into fire subcategories, the most incidents belonged to: Structure Fires (59.8%), and Outside Fires (24.7%).