Races in Roselle, New Jersey (NJ) Detailed Stats
Data:
Races - White alone (%)
Races - White alone (% change since 2000)
Races - Black alone (%)
Races - Black alone (% change since 2000)
Races - American Indian alone (%)
Races - American Indian alone (% change since 2000)
Races - Asian alone (%)
Races - Asian alone (% change since 2000)
Races - Hispanic (%)
Races - Hispanic (% change since 2000)
Races - Native Hawaiian and Other Pacific Islander alone (%)
Races - Native Hawaiian and Other Pacific Islander alone (% change since 2000)
Races - Two or more races(%)
Races - Two or more races(% change since 2000)
Races - Other race alone (%)
Races - Other race alone (% change since 2000)
Racial diversity
Place of birth - Born in state of residence (%)
Place of birth - Born in state of residence (%) - White
Place of birth - Born in state of residence (%) - Black or African American
Place of birth - Born in state of residence (%) - Asian
Place of birth - Born in state of residence (%) - Hispanic or Latino
Place of birth - Born in state of residence (%) - American Indian and Alaska Native
Place of birth - Born in state of residence (%) - Multirace
Place of birth - Born in state of residence (%) - Other Race
Place of birth - Born in other state (%)
Place of birth - Born in other state (%) - White
Place of birth - Born in other state (%) - Black or African American
Place of birth - Born in other state (%) - Asian
Place of birth - Born in other state (%) - Hispanic or Latino
Place of birth - Born in other state (%) - American Indian and Alaska Native
Place of birth - Born in other state (%) - Multirace
Place of birth - Born in other state (%) - Other Race
Place of birth - Native, outside of US (%)
Place of birth - Native, outside of US (%) - White
Place of birth - Native, outside of US (%) - Black or African American
Place of birth - Native, outside of US (%) - Asian
Place of birth - Native, outside of US (%) - Hispanic or Latino
Place of birth - Native, outside of US (%) - American Indian and Alaska Native
Place of birth - Native, outside of US (%) - Multirace
Place of birth - Native, outside of US (%) - Other Race
Place of birth - Foreign born (%)
Place of birth - Foreign born (%) - White
Place of birth - Foreign born (%) - Black or African American
Place of birth - Foreign born (%) - Asian
Place of birth - Foreign born (%) - Hispanic or Latino
Place of birth - Foreign born (%) - American Indian and Alaska Native
Place of birth - Foreign born (%) - Multirace
Place of birth - Foreign born (%) - Other Race
Residents speaking English at home (%)
Residents speaking English at home - Born in the United States (%)
Residents speaking English at home - Native, born elsewhere (%)
Residents speaking English at home - Foreign born (%)
Residents speaking Spanish at home (%)
Residents speaking Spanish at home - Born in the United States (%)
Residents speaking Spanish at home - Native, born elsewhere (%)
Residents speaking Spanish at home - Foreign born (%)
Residents speaking other language at home (%)
Residents speaking other language at home - Born in the United States (%)
Residents speaking other language at home - Native, born elsewhere (%)
Residents speaking other language at home - Foreign born (%)
Marital status - Never married (%)
Marital status - Now married (%)
Marital status - Separated (%)
Marital status - Widowed (%)
Marital status - Divorced (%)
Ancestries Reported - Arab (%)
Ancestries Reported - Czech (%)
Ancestries Reported - Danish (%)
Ancestries Reported - Dutch (%)
Ancestries Reported - English (%)
Ancestries Reported - French (%)
Ancestries Reported - French Canadian (%)
Ancestries Reported - German (%)
Ancestries Reported - Greek (%)
Ancestries Reported - Hungarian (%)
Ancestries Reported - Irish (%)
Ancestries Reported - Italian (%)
Ancestries Reported - Lithuanian (%)
Ancestries Reported - Norwegian (%)
Ancestries Reported - Polish (%)
Ancestries Reported - Portuguese (%)
Ancestries Reported - Russian (%)
Ancestries Reported - Scotch-Irish (%)
Ancestries Reported - Scottish (%)
Ancestries Reported - Slovak (%)
Ancestries Reported - Subsaharan African (%)
Ancestries Reported - Swedish (%)
Ancestries Reported - Swiss (%)
Ancestries Reported - Ukrainian (%)
Ancestries Reported - United States (%)
Ancestries Reported - Welsh (%)
Ancestries Reported - West Indian (%)
Ancestries Reported - Other (%)
Geographical mobility - Same house 1 year ago (%)
Geographical mobility - Same house 1 year ago (%) - White
Geographical mobility - Same house 1 year ago (%) - Black or African American
Geographical mobility - Same house 1 year ago (%) - Asian
Geographical mobility - Same house 1 year ago (%) - Hispanic or Latino
Geographical mobility - Same house 1 year ago (%) - American Indian and Alaska Native
Geographical mobility - Same house 1 year ago (%) - Multirace
Geographical mobility - Same house 1 year ago (%) - Other Race
Geographical mobility - Moved within same county (%)
Geographical mobility - Moved within same county (%) - White
Geographical mobility - Moved within same county (%) - Black or African American
Geographical mobility - Moved within same county (%) - Asian
Geographical mobility - Moved within same county (%) - Hispanic or Latino
Geographical mobility - Moved within same county (%) - American Indian and Alaska Native
Geographical mobility - Moved within same county (%) - Multirace
Geographical mobility - Moved within same county (%) - Other Race
Geographical mobility - Moved from different county within same state (%)
Geographical mobility - Moved from different county within same state (%) - White
Geographical mobility - Moved from different county within same state (%) - Black or African American
Geographical mobility - Moved from different county within same state (%) - Asian
Geographical mobility - Moved from different county within same state (%) - Hispanic or Latino
Geographical mobility - Moved from different county within same state (%) - American Indian and Alaska Native
Geographical mobility - Moved from different county within same state (%) - Multirace
Geographical mobility - Moved from different county within same state (%) - Other Race
Geographical mobility - Moved from different state (%)
Geographical mobility - Moved from different state (%) - White
Geographical mobility - Moved from different state (%) - Black or African American
Geographical mobility - Moved from different state (%) - Asian
Geographical mobility - Moved from different state (%) - Hispanic or Latino
Geographical mobility - Moved from different state (%) - American Indian and Alaska Native
Geographical mobility - Moved from different state (%) - Multirace
Geographical mobility - Moved from different state (%) - Other Race
Geographical mobility - Moved from abroad (%)
Geographical mobility - Moved from abroad (%) - White
Geographical mobility - Moved from abroad (%) - Black or African American
Geographical mobility - Moved from abroad (%) - Asian
Geographical mobility - Moved from abroad (%) - Hispanic or Latino
Geographical mobility - Moved from abroad (%) - American Indian and Alaska Native
Geographical mobility - Moved from abroad (%) - Multirace
Geographical mobility - Moved from abroad (%) - Other Race
Place of birth for the foreign-born population - Ireland (%)
Place of birth for the foreign-born population - Denmark (%)
Place of birth for the foreign-born population - Norway (%)
Place of birth for the foreign-born population - Sweden (%)
Place of birth for the foreign-born population - United Kingdom (%)
Place of birth for the foreign-born population - England (%)
Place of birth for the foreign-born population - Scotland (%)
Place of birth for the foreign-born population - Other Northern Europe (%)
Place of birth for the foreign-born population - Austria (%)
Place of birth for the foreign-born population - Belgium (%)
Place of birth for the foreign-born population - France (%)
Place of birth for the foreign-born population - Germany (%)
Place of birth for the foreign-born population - Netherlands (%)
Place of birth for the foreign-born population - Switzerland (%)
Place of birth for the foreign-born population - Other Western Europe (%)
Place of birth for the foreign-born population - Greece (%)
Place of birth for the foreign-born population - Italy (%)
Place of birth for the foreign-born population - Portugal (%)
Place of birth for the foreign-born population - Spain (%)
Place of birth for the foreign-born population - Other Southern Europe (%)
Place of birth for the foreign-born population - Albania (%)
Place of birth for the foreign-born population - Belarus (%)
Place of birth for the foreign-born population - Bosnia and Herzegovina (%)
Place of birth for the foreign-born population - Bulgaria (%)
Place of birth for the foreign-born population - Croatia (%)
Place of birth for the foreign-born population - Czechoslovakia (%)
Place of birth for the foreign-born population - Hungary (%)
Place of birth for the foreign-born population - Latvia (%)
Place of birth for the foreign-born population - Lithuania (%)
Place of birth for the foreign-born population - North Macedonia (Macedonia) (%)
Place of birth for the foreign-born population - Moldova (%)
Place of birth for the foreign-born population - Poland (%)
Place of birth for the foreign-born population - Romania (%)
Place of birth for the foreign-born population - Russia (%)
Place of birth for the foreign-born population - Serbia (%)
Place of birth for the foreign-born population - Ukraine (%)
Place of birth for the foreign-born population - Other Eastern Europe (%)
Place of birth for the foreign-born population - China (%)
Place of birth for the foreign-born population - Hong Kong (%)
Place of birth for the foreign-born population - Taiwan (%)
Place of birth for the foreign-born population - Japan (%)
Place of birth for the foreign-born population - Korea (%)
Place of birth for the foreign-born population - Other Eastern Asia (%)
Place of birth for the foreign-born population - Afghanistan (%)
Place of birth for the foreign-born population - Bangladesh (%)
Place of birth for the foreign-born population - India (%)
Place of birth for the foreign-born population - Iran (%)
Place of birth for the foreign-born population - Kazakhstan (%)
Place of birth for the foreign-born population - Nepal (%)
Place of birth for the foreign-born population - Pakistan (%)
Place of birth for the foreign-born population - Sri Lanka (%)
Place of birth for the foreign-born population - Uzbekistan (%)
Place of birth for the foreign-born population - Other South Central Asia (%)
Place of birth for the foreign-born population - Burma (%)
Place of birth for the foreign-born population - Cambodia (%)
Place of birth for the foreign-born population - Indonesia (%)
Place of birth for the foreign-born population - Laos (%)
Place of birth for the foreign-born population - Malaysia (%)
Place of birth for the foreign-born population - Philippines (%)
Place of birth for the foreign-born population - Singapore (%)
Place of birth for the foreign-born population - Thailand (%)
Place of birth for the foreign-born population - Vietnam (%)
Place of birth for the foreign-born population - Other South Eastern Asia (%)
Place of birth for the foreign-born population - Armenia (%)
Place of birth for the foreign-born population - Iraq (%)
Place of birth for the foreign-born population - Israel (%)
Place of birth for the foreign-born population - Jordan (%)
Place of birth for the foreign-born population - Kuwait (%)
Place of birth for the foreign-born population - Lebanon (%)
Place of birth for the foreign-born population - Saudi Arabia (%)
Place of birth for the foreign-born population - Syria (%)
Place of birth for the foreign-born population - Turkey (%)
Place of birth for the foreign-born population - Yemen (%)
Place of birth for the foreign-born population - Other Western Asia (%)
Place of birth for the foreign-born population - Eritrea (%)
Place of birth for the foreign-born population - Ethiopia (%)
Place of birth for the foreign-born population - Kenya (%)
Place of birth for the foreign-born population - Somalia (%)
Place of birth for the foreign-born population - Uganda (%)
Place of birth for the foreign-born population - Zimbabwe (%)
Place of birth for the foreign-born population - Other Eastern Africa (%)
Place of birth for the foreign-born population - Cameroon (%)
Place of birth for the foreign-born population - Congo (%)
Place of birth for the foreign-born population - Democratic Republic of Congo (Zaire) (%)
Place of birth for the foreign-born population - Other Middle Africa (%)
Place of birth for the foreign-born population - Egypt (%)
Place of birth for the foreign-born population - Morocco (%)
Place of birth for the foreign-born population - Sudan (%)
Place of birth for the foreign-born population - Other Northern Africa (%)
Place of birth for the foreign-born population - South Africa (%)
Place of birth for the foreign-born population - Other Southern Africa (%)
Place of birth for the foreign-born population - Cabo Verde (%)
Place of birth for the foreign-born population - Ghana (%)
Place of birth for the foreign-born population - Liberia (%)
Place of birth for the foreign-born population - Nigeria (%)
Place of birth for the foreign-born population - Senegal (%)
Place of birth for the foreign-born population - Sierra Leone (%)
Place of birth for the foreign-born population - Other Western Africa (%)
Place of birth for the foreign-born population - Australia (%)
Place of birth for the foreign-born population - New Zealand (%)
Place of birth for the foreign-born population - Fiji (%)
Place of birth for the foreign-born population - Micronesia (%)
Place of birth for the foreign-born population - Bahamas (%)
Place of birth for the foreign-born population - Barbados (%)
Place of birth for the foreign-born population - Cuba (%)
Place of birth for the foreign-born population - Dominica (%)
Place of birth for the foreign-born population - Dominican Republic (%)
Place of birth for the foreign-born population - Grenada (%)
Place of birth for the foreign-born population - Haiti (%)
Place of birth for the foreign-born population - Jamaica (%)
Place of birth for the foreign-born population - St. Vincent and the Grenadines (%)
Place of birth for the foreign-born population - Trinidad and Tobago (%)
Place of birth for the foreign-born population - West Indies (%)
Place of birth for the foreign-born population - Other Caribbean (%)
Place of birth for the foreign-born population - Belize (%)
Place of birth for the foreign-born population - Costa Rica (%)
Place of birth for the foreign-born population - El Salvador (%)
Place of birth for the foreign-born population - Guatemala (%)
Place of birth for the foreign-born population - Honduras (%)
Place of birth for the foreign-born population - Mexico (%)
Place of birth for the foreign-born population - Nicaragua (%)
Place of birth for the foreign-born population - Panama (%)
Place of birth for the foreign-born population - Other Central America (%)
Place of birth for the foreign-born population - Argentina (%)
Place of birth for the foreign-born population - Bolivia (%)
Place of birth for the foreign-born population - Brazil (%)
Place of birth for the foreign-born population - Chile (%)
Place of birth for the foreign-born population - Colombia (%)
Place of birth for the foreign-born population - Ecuador (%)
Place of birth for the foreign-born population - Guyana (%)
Place of birth for the foreign-born population - Peru (%)
Place of birth for the foreign-born population - Uruguay (%)
Place of birth for the foreign-born population - Venezuela (%)
Place of birth for the foreign-born population - Other South America (%)
Place of birth for the foreign-born population - Canada (%)
Place of birth for the foreign-born population - Other Northern America (%)
Place of birth for the foreign-born population - Other (%)
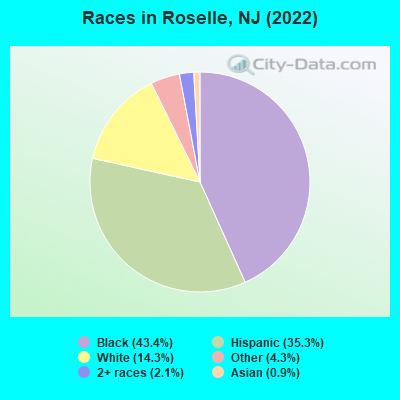
According to 2022 data, the most numerous races in Roselle, NJ are White alone (3,201 residents), Hispanic (7,919 residents), and Black alone (9,731 residents). 55.6% of Roselle residents speak English at home. 32.7% of Roselle, NJ residents are foreign-born (28.3% born in Latin America), which is 29.7% greater than the foreign-born rate of 23.0% across the entire state of New Jersey.
Race distribution in Roselle
2000 2022
5,557,209 66.0% White alone 1,117,191 13.3% Hispanic 1,096,171 13.0% Black alone 477,012 5.7% Asian alone 133,689 1.6% Two or more races 19,565 0.2% Other race alone 11,338 0.1% American Indian alone 2,175 0.03% Native Hawaiian and Other
4,766,476 51.5% White alone 2,028,470 21.9% Hispanic 1,111,632 12.0% Black alone 923,546 10.0% Asian alone 332,237 3.6% Two or more races 89,847 1.0% Other race alone 8,557 0.09% American Indian alone 934 0.01% Native Hawaiian and Other
Income and house value in Roselle Median household income in 2022 $79,965 White non-Hispanic householders$75,975 Black householders$104,202 Asian householders$76,249 Some other race householders$88,414 Two or more races householders$88,279 Hispanic or Latino race householdersMedian 2022 house value $301,023 White Non-Hispanic householders$321,464 Black or African American householders $403,716 Asian householders$306,376 Some other race householders$329,251 Two or more races householders$310,270 Hispanic or Latino householders
Median age by race in Roselle
49.5 Median age for White residents42.2 50.6 38.2 Median age for Black or African American residents35.6 40.1 -656,626,505.4 Median age for American Indian / Alaska Native residents-749,529,189.5 -612,668,742.9 37.7 Median age for Asian residents29.5 38.8 -1,010,045,661.1 Median age for Native Hawaiian / Pacific Islander residents-860,335,194.7 -713,070,378.3 36.0 Median age for Other race residents36.8 33.1 37.9 Median age for Two or more races residents40.8 37.4 52.7 Median age for White alone residents49.9 54.1 37.1 Median age for Hispanic or Latino residents38.7 36.7
Owner/renter occupied households by race in Roselle
House owners and renters - White residents 1,169 67.8% Owner occupied555 32.2% Renter occupiedHouse owners and renters - Black or African American residents 1,865 48.0% Owner occupied2,024 52.0% Renter occupiedHouse owners and renters - Asian residents 99 65.8% Owner occupied52 34.2% Renter occupiedHouse owners and renters - Native Hawaiian / Pacific Islander residents 30 100.0% Owner occupiedHouse owners and renters - Other race residents 1,121 62.8% Owner occupied663 37.2% Renter occupiedHouse owners and renters - Two or more races residents 404 34.9% Owner occupied756 65.1% Renter occupiedHouse owners and renters - White alone residents 999 65.0% Owner occupied537 35.0% Renter occupiedHouse owners and renters - Hispanic or Latino residents 1,497 62.0% Owner occupied919 38.0% Renter occupied
Language usage in Roselle
English speakers - Total 55.6% of residents of Roselle speak English at home.
28.7% of residents speak Spanish at home 3,141 51.0% Speak English very well3,014 49.0% Speak English less than very well15.1% of residents speak other language at home 2,511 77.4% Speak English very well734 22.6% Speak English less than very well
English speakers - Born in the United States 87.7% of residents of Roselle speak English at home.
6.7% of residents speak Spanish at home 248 90.8% Speak English very well25 9.2% Speak English less than very well5.4% of residents speak other language at home 214 97.3% Speak English very well6 2.7% Speak English less than very well
English speakers - Native, born elsewhere 24.3% of residents of Roselle speak English at home.
68.1% of residents speak Spanish at home 302 71.9% Speak English very well118 28.1% Speak English less than very well7.8% of residents speak other language at home 30 62.5% Speak English very well18 37.5% Speak English less than very well
English speakers - Foreign-born 16.0% of residents of Roselle speak English at home.
50.8% of residents speak Spanish at home 1,223 32.1% Speak English very well2,584 67.9% Speak English less than very well31.2% of residents speak other language at home 1,634 70.0% Speak English very well701 30.0% Speak English less than very well
White (Caucasian) - Speak only English Native:
86.9% (2,801)Foreign-born:
4.9% (32)
White (Caucasian) - Speak another language Native:
12.6% (408)Foreign-born:
94.6% (620)
Black or African American - Speak only English Native:
91.5% (6,282)Foreign-born:
27.6% (713)
Black or African American - Speak another language Native:
8.3% (567)Foreign-born:
72.0% (1,862)
Asian - Speak only English Native:
60.5% (81)Foreign-born:
29.6% (34)
Asian - Speak another language Native:
37.5% (50)Foreign-born:
71.6% (81)
Other race - Speak only English Native:
32.5% (712)Foreign-born:
14.6% (412)
Other race - Speak another language Native:
68.7% (1,505)Foreign-born:
88.7% (2,495)
Two or more races - Speak only English Native:
46.8% (838)Foreign-born:
5.3% (91)
Two or more races - Speak another language Native:
53.7% (961)Foreign-born:
94.5% (1,610)
White alone - Speak only English Native:
89.9% (2,652)Foreign-born:
4.8% (10)
White alone - Speak another language Native:
10.1% (297)Foreign-born:
97.0% (199)
Hispanic or Latino - Speak only English Native:
35.1% (1,192)Foreign-born:
4.5% (184)
Hispanic or Latino - Speak another language Native:
65.0% (2,204)Foreign-born:
95.7% (3,942)
Foreign-born residents in Roselle 7,327 residents are foreign born (28.3% Latin America ).
This city:
32.7%New Jersey:
23.2%
Marital status for residents in Roselle Marital status - White (Caucasian) population 15 years and over
Males 42.8% Never married46.5% Now married0.8% Separated2.9% Widowed7.1% DivorcedFemales 42.3% Never married32.9% Now married5.0% Separated12.2% Widowed7.5% DivorcedWomen who gave birth in the past 12 months Now married:
66.2% (38)Unmarried:
33.8% (20)
Women who did not give birth in the past 12 months Now married:
33.4% (329)Unmarried:
66.6% (656)
Marital status - Black or African American population 15 years and over
Males 47.6% Never married39.4% Now married4.6% Separated3.6% Widowed4.8% DivorcedFemales 44.3% Never married28.8% Now married3.6% Separated10.1% Widowed13.2% DivorcedWomen who gave birth in the past 12 months Now married:
63.2% (102)Unmarried:
36.8% (59)
Women who did not give birth in the past 12 months Now married:
24.6% (617)Unmarried:
75.4% (1,892)
Marital status - Asian population 15 years and over
Males 36.7% Never married51.0% Now married0.0% Separated0.0% Widowed12.2% DivorcedFemales 26.5% Never married27.9% Now married0.0% Separated8.8% Widowed36.7% DivorcedWomen who did not give birth in the past 12 months Now married:
14.1% (13)Unmarried:
85.9% (77)
Marital status - Other race population 15 years and over
Males 40.4% Never married43.1% Now married7.1% Separated0.0% Widowed9.4% DivorcedFemales 47.1% Never married37.2% Now married2.1% Separated8.9% Widowed4.6% DivorcedWomen who gave birth in the past 12 months Now married:
100.0% (43)Unmarried:
0.0% (0)
Women who did not give birth in the past 12 months Now married:
45.9% (582)Unmarried:
54.1% (687)
Marital status - Two or more races population 15 years and over
Males 30.6% Never married57.9% Now married2.9% Separated1.5% Widowed7.1% DivorcedFemales 37.1% Never married45.2% Now married3.5% Separated2.9% Widowed11.3% DivorcedWomen who gave birth in the past 12 months Now married:
51.6% (21)Unmarried:
48.4% (20)
Women who did not give birth in the past 12 months Now married:
40.2% (388)Unmarried:
59.8% (576)
Marital status - White alone, not Hispanic / Latino population 15 years and over
Males 44.6% Never married44.4% Now married0.0% Separated3.6% Widowed7.4% DivorcedFemales 43.9% Never married30.9% Now married5.8% Separated12.9% Widowed6.6% DivorcedWomen who gave birth in the past 12 months Now married:
66.2% (42)Unmarried:
33.8% (21)
Women who did not give birth in the past 12 months Now married:
27.6% (219)Unmarried:
72.4% (574)
Marital status - Hispanic or Latino population 15 years and over
Males 37.0% Never married51.1% Now married5.6% Separated0.2% Widowed6.1% DivorcedFemales 41.8% Never married41.0% Now married1.5% Separated8.3% Widowed7.4% DivorcedWomen who gave birth in the past 12 months Now married:
79.2% (57)Unmarried:
20.8% (15)
Women who did not give birth in the past 12 months Now married:
44.4% (882)Unmarried:
55.6% (1,105)
Ancestries in Roselle
1,534 10.3% Haitian493 3.3% American364 2.4% African361 2.4% Jamaican330 2.2% Brazilian289 1.9% Italian271 1.8% Polish195 1.3% European174 1.2% Trinidadian and Tobagonian171 1.1% Irish152 1.0% Portuguese143 1.0% Guyanese94 0.6% Nigerian85 0.6% German59 0.4% British West Indian28 0.2% Ukrainian26 0.2% West Indian25 0.2% Eastern European12 0.08% Hungarian10 0.07% Norwegian8 0.05% English8 0.05% Slovak7 0.05% Russian6 0.04% Liberian
Children Nativity (place of birth) in Roselle
Children under 6 years - Living with two parents Both parents native 259 100.0% NativeBoth parents foreign-born 321 100.0% NativeOne native, one foreign-born parent 31 100.0% NativeChildren under 6 years - Living with one parent Native parent 445 100.0% NativeForeign-born parent 52 100.0% NativeChildren 6 to 17 years - Living with two parents Both parents native 527 100.0% NativeBoth parents foreign-born 750 80.6% Native181 19.4% Foreign-bornOne native, one foreign-born parent 150 100.0% NativeChildren 6 to 17 years - Living with one parent Native parent 1,043 100.0% NativeForeign-born parent 381 52.7% Native343 47.3% Foreign-born
Grandparents responsible for own grandchildren in Roselle
Grandparents (30 to 59 years) White / Caucasian 20 42.5% Responsible for grandchildren27 57.5% Not responsible for grandchildrenBlack or African American 6 1.9% Responsible for grandchildren290 98.1% Not responsible for grandchildrenOther race 48 100.0% Not responsible for grandchildrenTwo or more races 26 32.5% Responsible for grandchildren54 67.5% Not responsible for grandchildrenWhite alone, not Hispanic / Latino 15 100.0% Not responsible for grandchildrenHispanic or Latino 22 13.4% Responsible for grandchildren143 86.6% Not responsible for grandchildrenGrandparents (60 years and over) White / Caucasian 35 70.6% Responsible for grandchildren15 29.4% Not responsible for grandchildrenBlack or African American 46 12.6% Responsible for grandchildren319 87.4% Not responsible for grandchildrenOther race 174 100.0% Not responsible for grandchildrenTwo or more races 9 11.6% Responsible for grandchildren66 88.4% Not responsible for grandchildrenWhite alone, not Hispanic / Latino 40 71.1% Responsible for grandchildren16 28.9% Not responsible for grandchildrenHispanic or Latino 4 2.4% Responsible for grandchildren152 97.6% Not responsible for grandchildren