Morganton, North Carolina Submit your own pictures of this city and show them to the world
OSM Map
General Map
Google Map
MSN Map
OSM Map
General Map
Google Map
MSN Map
OSM Map
General Map
Google Map
MSN Map
OSM Map
General Map
Google Map
MSN Map
Please wait while loading the map...
Population in 2022: 17,602 (98% urban, 2% rural). Population change since 2000: +1.7%Males: 8,491 Females: 9,111
March 2022 cost of living index in Morganton: 85.8 (less than average, U.S. average is 100) Percentage of residents living in poverty in 2022: 28.0%for White Non-Hispanic residents , 31.5% for Black residents , 42.4% for Hispanic or Latino residents , 35.2% for American Indian residents , 57.5% for other race residents , 37.0% for two or more races residents )
Profiles of local businesses
Business Search - 14 Million verified businesses
Data:
Median household income ($)
Median household income (% change since 2000)
Household income diversity
Ratio of average income to average house value (%)
Ratio of average income to average rent
Median household income ($) - White
Median household income ($) - Black or African American
Median household income ($) - Asian
Median household income ($) - Hispanic or Latino
Median household income ($) - American Indian and Alaska Native
Median household income ($) - Multirace
Median household income ($) - Other Race
Median household income for houses/condos with a mortgage ($)
Median household income for apartments without a mortgage ($)
Races - White alone (%)
Races - White alone (% change since 2000)
Races - Black alone (%)
Races - Black alone (% change since 2000)
Races - American Indian alone (%)
Races - American Indian alone (% change since 2000)
Races - Asian alone (%)
Races - Asian alone (% change since 2000)
Races - Hispanic (%)
Races - Hispanic (% change since 2000)
Races - Native Hawaiian and Other Pacific Islander alone (%)
Races - Native Hawaiian and Other Pacific Islander alone (% change since 2000)
Races - Two or more races (%)
Races - Two or more races (% change since 2000)
Races - Other race alone (%)
Races - Other race alone (% change since 2000)
Racial diversity
Unemployment (%)
Unemployment (% change since 2000)
Unemployment (%) - White
Unemployment (%) - Black or African American
Unemployment (%) - Asian
Unemployment (%) - Hispanic or Latino
Unemployment (%) - American Indian and Alaska Native
Unemployment (%) - Multirace
Unemployment (%) - Other Race
Population density (people per square mile)
Population - Males (%)
Population - Females (%)
Population - Males (%) - White
Population - Males (%) - Black or African American
Population - Males (%) - Asian
Population - Males (%) - Hispanic or Latino
Population - Males (%) - American Indian and Alaska Native
Population - Males (%) - Multirace
Population - Males (%) - Other Race
Population - Females (%) - White
Population - Females (%) - Black or African American
Population - Females (%) - Asian
Population - Females (%) - Hispanic or Latino
Population - Females (%) - American Indian and Alaska Native
Population - Females (%) - Multirace
Population - Females (%) - Other Race
Coronavirus confirmed cases (May 23, 2024)
Deaths caused by coronavirus (May 23, 2024)
Coronavirus confirmed cases (per 100k population) (May 23, 2024)
Deaths caused by coronavirus (per 100k population) (May 23, 2024)
Daily increase in number of cases (May 23, 2024)
Weekly increase in number of cases (May 23, 2024)
Cases doubled (in days) (May 23, 2024)
Hospitalized patients (Apr 18, 2022)
Negative test results (Apr 18, 2022)
Total test results (Apr 18, 2022)
COVID Vaccine doses distributed (per 100k population) (Sep 19, 2023)
COVID Vaccine doses administered (per 100k population) (Sep 19, 2023)
COVID Vaccine doses distributed (Sep 19, 2023)
COVID Vaccine doses administered (Sep 19, 2023)
Likely homosexual households (%)
Likely homosexual households (% change since 2000)
Likely homosexual households - Lesbian couples (%)
Likely homosexual households - Lesbian couples (% change since 2000)
Likely homosexual households - Gay men (%)
Likely homosexual households - Gay men (% change since 2000)
Cost of living index
Median gross rent ($)
Median contract rent ($)
Median monthly housing costs ($)
Median house or condo value ($)
Median house or condo value ($ change since 2000)
Mean house or condo value by units in structure - 1, detached ($)
Mean house or condo value by units in structure - 1, attached ($)
Mean house or condo value by units in structure - 2 ($)
Mean house or condo value by units in structure by units in structure - 3 or 4 ($)
Mean house or condo value by units in structure - 5 or more ($)
Mean house or condo value by units in structure - Boat, RV, van, etc. ($)
Mean house or condo value by units in structure - Mobile home ($)
Median house or condo value ($) - White
Median house or condo value ($) - Black or African American
Median house or condo value ($) - Asian
Median house or condo value ($) - Hispanic or Latino
Median house or condo value ($) - American Indian and Alaska Native
Median house or condo value ($) - Multirace
Median house or condo value ($) - Other Race
Median resident age
Resident age diversity
Median resident age - Males
Median resident age - Females
Median resident age - White
Median resident age - Black or African American
Median resident age - Asian
Median resident age - Hispanic or Latino
Median resident age - American Indian and Alaska Native
Median resident age - Multirace
Median resident age - Other Race
Median resident age - Males - White
Median resident age - Males - Black or African American
Median resident age - Males - Asian
Median resident age - Males - Hispanic or Latino
Median resident age - Males - American Indian and Alaska Native
Median resident age - Males - Multirace
Median resident age - Males - Other Race
Median resident age - Females - White
Median resident age - Females - Black or African American
Median resident age - Females - Asian
Median resident age - Females - Hispanic or Latino
Median resident age - Females - American Indian and Alaska Native
Median resident age - Females - Multirace
Median resident age - Females - Other Race
Commute - mean travel time to work (minutes)
Travel time to work - Less than 5 minutes (%)
Travel time to work - Less than 5 minutes (% change since 2000)
Travel time to work - 5 to 9 minutes (%)
Travel time to work - 5 to 9 minutes (% change since 2000)
Travel time to work - 10 to 19 minutes (%)
Travel time to work - 10 to 19 minutes (% change since 2000)
Travel time to work - 20 to 29 minutes (%)
Travel time to work - 20 to 29 minutes (% change since 2000)
Travel time to work - 30 to 39 minutes (%)
Travel time to work - 30 to 39 minutes (% change since 2000)
Travel time to work - 40 to 59 minutes (%)
Travel time to work - 40 to 59 minutes (% change since 2000)
Travel time to work - 60 to 89 minutes (%)
Travel time to work - 60 to 89 minutes (% change since 2000)
Travel time to work - 90 or more minutes (%)
Travel time to work - 90 or more minutes (% change since 2000)
Marital status - Never married (%)
Marital status - Now married (%)
Marital status - Separated (%)
Marital status - Widowed (%)
Marital status - Divorced (%)
Median family income ($)
Median family income (% change since 2000)
Median non-family income ($)
Median non-family income (% change since 2000)
Median per capita income ($)
Median per capita income (% change since 2000)
Median family income ($) - White
Median family income ($) - Black or African American
Median family income ($) - Asian
Median family income ($) - Hispanic or Latino
Median family income ($) - American Indian and Alaska Native
Median family income ($) - Multirace
Median family income ($) - Other Race
Median year house/condo built
Median year apartment built
Year house built - Built 2005 or later (%)
Year house built - Built 2000 to 2004 (%)
Year house built - Built 1990 to 1999 (%)
Year house built - Built 1980 to 1989 (%)
Year house built - Built 1970 to 1979 (%)
Year house built - Built 1960 to 1969 (%)
Year house built - Built 1950 to 1959 (%)
Year house built - Built 1940 to 1949 (%)
Year house built - Built 1939 or earlier (%)
Average household size
Household density (households per square mile)
Average household size - White
Average household size - Black or African American
Average household size - Asian
Average household size - Hispanic or Latino
Average household size - American Indian and Alaska Native
Average household size - Multirace
Average household size - Other Race
Occupied housing units (%)
Vacant housing units (%)
Owner occupied housing units (%)
Renter occupied housing units (%)
Vacancy status - For rent (%)
Vacancy status - For sale only (%)
Vacancy status - Rented or sold, not occupied (%)
Vacancy status - For seasonal, recreational, or occasional use (%)
Vacancy status - For migrant workers (%)
Vacancy status - Other vacant (%)
Residents with income below the poverty level (%)
Residents with income below 50% of the poverty level (%)
Children below poverty level (%)
Poor families by family type - Married-couple family (%)
Poor families by family type - Male, no wife present (%)
Poor families by family type - Female, no husband present (%)
Poverty status for native-born residents (%)
Poverty status for foreign-born residents (%)
Poverty among high school graduates not in families (%)
Poverty among people who did not graduate high school not in families (%)
Residents with income below the poverty level (%) - White
Residents with income below the poverty level (%) - Black or African American
Residents with income below the poverty level (%) - Asian
Residents with income below the poverty level (%) - Hispanic or Latino
Residents with income below the poverty level (%) - American Indian and Alaska Native
Residents with income below the poverty level (%) - Multirace
Residents with income below the poverty level (%) - Other Race
Air pollution - Air Quality Index (AQI)
Air pollution - CO
Air pollution - NO2
Air pollution - SO2
Air pollution - Ozone
Air pollution - PM10
Air pollution - PM25
Air pollution - Pb
Crime - Murders per 100,000 population
Crime - Rapes per 100,000 population
Crime - Robberies per 100,000 population
Crime - Assaults per 100,000 population
Crime - Burglaries per 100,000 population
Crime - Thefts per 100,000 population
Crime - Auto thefts per 100,000 population
Crime - Arson per 100,000 population
Crime - City-data.com crime index
Crime - Violent crime index
Crime - Property crime index
Crime - Murders per 100,000 population (5 year average)
Crime - Rapes per 100,000 population (5 year average)
Crime - Robberies per 100,000 population (5 year average)
Crime - Assaults per 100,000 population (5 year average)
Crime - Burglaries per 100,000 population (5 year average)
Crime - Thefts per 100,000 population (5 year average)
Crime - Auto thefts per 100,000 population (5 year average)
Crime - Arson per 100,000 population (5 year average)
Crime - City-data.com crime index (5 year average)
Crime - Violent crime index (5 year average)
Crime - Property crime index (5 year average)
1996 Presidential Elections Results (%) - Democratic Party (Clinton)
1996 Presidential Elections Results (%) - Republican Party (Dole)
1996 Presidential Elections Results (%) - Other
2000 Presidential Elections Results (%) - Democratic Party (Gore)
2000 Presidential Elections Results (%) - Republican Party (Bush)
2000 Presidential Elections Results (%) - Other
2004 Presidential Elections Results (%) - Democratic Party (Kerry)
2004 Presidential Elections Results (%) - Republican Party (Bush)
2004 Presidential Elections Results (%) - Other
2008 Presidential Elections Results (%) - Democratic Party (Obama)
2008 Presidential Elections Results (%) - Republican Party (McCain)
2008 Presidential Elections Results (%) - Other
2012 Presidential Elections Results (%) - Democratic Party (Obama)
2012 Presidential Elections Results (%) - Republican Party (Romney)
2012 Presidential Elections Results (%) - Other
2016 Presidential Elections Results (%) - Democratic Party (Clinton)
2016 Presidential Elections Results (%) - Republican Party (Trump)
2016 Presidential Elections Results (%) - Other
2020 Presidential Elections Results (%) - Democratic Party (Biden)
2020 Presidential Elections Results (%) - Republican Party (Trump)
2020 Presidential Elections Results (%) - Other
Ancestries Reported - Arab (%)
Ancestries Reported - Czech (%)
Ancestries Reported - Danish (%)
Ancestries Reported - Dutch (%)
Ancestries Reported - English (%)
Ancestries Reported - French (%)
Ancestries Reported - French Canadian (%)
Ancestries Reported - German (%)
Ancestries Reported - Greek (%)
Ancestries Reported - Hungarian (%)
Ancestries Reported - Irish (%)
Ancestries Reported - Italian (%)
Ancestries Reported - Lithuanian (%)
Ancestries Reported - Norwegian (%)
Ancestries Reported - Polish (%)
Ancestries Reported - Portuguese (%)
Ancestries Reported - Russian (%)
Ancestries Reported - Scotch-Irish (%)
Ancestries Reported - Scottish (%)
Ancestries Reported - Slovak (%)
Ancestries Reported - Subsaharan African (%)
Ancestries Reported - Swedish (%)
Ancestries Reported - Swiss (%)
Ancestries Reported - Ukrainian (%)
Ancestries Reported - United States (%)
Ancestries Reported - Welsh (%)
Ancestries Reported - West Indian (%)
Ancestries Reported - Other (%)
Educational Attainment - No schooling completed (%)
Educational Attainment - Less than high school (%)
Educational Attainment - High school or equivalent (%)
Educational Attainment - Less than 1 year of college (%)
Educational Attainment - 1 or more years of college (%)
Educational Attainment - Associate degree (%)
Educational Attainment - Bachelor's degree (%)
Educational Attainment - Master's degree (%)
Educational Attainment - Professional school degree (%)
Educational Attainment - Doctorate degree (%)
School Enrollment - Nursery, preschool (%)
School Enrollment - Kindergarten (%)
School Enrollment - Grade 1 to 4 (%)
School Enrollment - Grade 5 to 8 (%)
School Enrollment - Grade 9 to 12 (%)
School Enrollment - College undergrad (%)
School Enrollment - Graduate or professional (%)
School Enrollment - Not enrolled in school (%)
School enrollment - Public schools (%)
School enrollment - Private schools (%)
School enrollment - Not enrolled (%)
Median number of rooms in houses and condos
Median number of rooms in apartments
Housing units lacking complete plumbing facilities (%)
Housing units lacking complete kitchen facilities (%)
Density of houses
Urban houses (%)
Rural houses (%)
Households with people 60 years and over (%)
Households with people 65 years and over (%)
Households with people 75 years and over (%)
Households with one or more nonrelatives (%)
Households with no nonrelatives (%)
Population in households (%)
Family households (%)
Nonfamily households (%)
Population in families (%)
Family households with own children (%)
Median number of bedrooms in owner occupied houses
Mean number of bedrooms in owner occupied houses
Median number of bedrooms in renter occupied houses
Mean number of bedrooms in renter occupied houses
Median number of vehichles in owner occupied houses
Mean number of vehichles in owner occupied houses
Median number of vehichles in renter occupied houses
Mean number of vehichles in renter occupied houses
Mortgage status - with mortgage (%)
Mortgage status - with second mortgage (%)
Mortgage status - with home equity loan (%)
Mortgage status - with both second mortgage and home equity loan (%)
Mortgage status - without a mortgage (%)
Average family size
Average family size - White
Average family size - Black or African American
Average family size - Asian
Average family size - Hispanic or Latino
Average family size - American Indian and Alaska Native
Average family size - Multirace
Average family size - Other Race
Geographical mobility - Same house 1 year ago (%)
Geographical mobility - Moved within same county (%)
Geographical mobility - Moved from different county within same state (%)
Geographical mobility - Moved from different state (%)
Geographical mobility - Moved from abroad (%)
Place of birth - Born in state of residence (%)
Place of birth - Born in other state (%)
Place of birth - Native, outside of US (%)
Place of birth - Foreign born (%)
Housing units in structures - 1, detached (%)
Housing units in structures - 1, attached (%)
Housing units in structures - 2 (%)
Housing units in structures - 3 or 4 (%)
Housing units in structures - 5 to 9 (%)
Housing units in structures - 10 to 19 (%)
Housing units in structures - 20 to 49 (%)
Housing units in structures - 50 or more (%)
Housing units in structures - Mobile home (%)
Housing units in structures - Boat, RV, van, etc. (%)
House/condo owner moved in on average (years ago)
Renter moved in on average (years ago)
Year householder moved into unit - Moved in 1999 to March 2000 (%)
Year householder moved into unit - Moved in 1995 to 1998 (%)
Year householder moved into unit - Moved in 1990 to 1994 (%)
Year householder moved into unit - Moved in 1980 to 1989 (%)
Year householder moved into unit - Moved in 1970 to 1979 (%)
Year householder moved into unit - Moved in 1969 or earlier (%)
Means of transportation to work - Drove car alone (%)
Means of transportation to work - Carpooled (%)
Means of transportation to work - Public transportation (%)
Means of transportation to work - Bus or trolley bus (%)
Means of transportation to work - Streetcar or trolley car (%)
Means of transportation to work - Subway or elevated (%)
Means of transportation to work - Railroad (%)
Means of transportation to work - Ferryboat (%)
Means of transportation to work - Taxicab (%)
Means of transportation to work - Motorcycle (%)
Means of transportation to work - Bicycle (%)
Means of transportation to work - Walked (%)
Means of transportation to work - Other means (%)
Working at home (%)
Industry diversity
Most Common Industries - Agriculture, forestry, fishing and hunting, and mining (%)
Most Common Industries - Agriculture, forestry, fishing and hunting (%)
Most Common Industries - Mining, quarrying, and oil and gas extraction (%)
Most Common Industries - Construction (%)
Most Common Industries - Manufacturing (%)
Most Common Industries - Wholesale trade (%)
Most Common Industries - Retail trade (%)
Most Common Industries - Transportation and warehousing, and utilities (%)
Most Common Industries - Transportation and warehousing (%)
Most Common Industries - Utilities (%)
Most Common Industries - Information (%)
Most Common Industries - Finance and insurance, and real estate and rental and leasing (%)
Most Common Industries - Finance and insurance (%)
Most Common Industries - Real estate and rental and leasing (%)
Most Common Industries - Professional, scientific, and management, and administrative and waste management services (%)
Most Common Industries - Professional, scientific, and technical services (%)
Most Common Industries - Management of companies and enterprises (%)
Most Common Industries - Administrative and support and waste management services (%)
Most Common Industries - Educational services, and health care and social assistance (%)
Most Common Industries - Educational services (%)
Most Common Industries - Health care and social assistance (%)
Most Common Industries - Arts, entertainment, and recreation, and accommodation and food services (%)
Most Common Industries - Arts, entertainment, and recreation (%)
Most Common Industries - Accommodation and food services (%)
Most Common Industries - Other services, except public administration (%)
Most Common Industries - Public administration (%)
Occupation diversity
Most Common Occupations - Management, business, science, and arts occupations (%)
Most Common Occupations - Management, business, and financial occupations (%)
Most Common Occupations - Management occupations (%)
Most Common Occupations - Business and financial operations occupations (%)
Most Common Occupations - Computer, engineering, and science occupations (%)
Most Common Occupations - Computer and mathematical occupations (%)
Most Common Occupations - Architecture and engineering occupations (%)
Most Common Occupations - Life, physical, and social science occupations (%)
Most Common Occupations - Education, legal, community service, arts, and media occupations (%)
Most Common Occupations - Community and social service occupations (%)
Most Common Occupations - Legal occupations (%)
Most Common Occupations - Education, training, and library occupations (%)
Most Common Occupations - Arts, design, entertainment, sports, and media occupations (%)
Most Common Occupations - Healthcare practitioners and technical occupations (%)
Most Common Occupations - Health diagnosing and treating practitioners and other technical occupations (%)
Most Common Occupations - Health technologists and technicians (%)
Most Common Occupations - Service occupations (%)
Most Common Occupations - Healthcare support occupations (%)
Most Common Occupations - Protective service occupations (%)
Most Common Occupations - Fire fighting and prevention, and other protective service workers including supervisors (%)
Most Common Occupations - Law enforcement workers including supervisors (%)
Most Common Occupations - Food preparation and serving related occupations (%)
Most Common Occupations - Building and grounds cleaning and maintenance occupations (%)
Most Common Occupations - Personal care and service occupations (%)
Most Common Occupations - Sales and office occupations (%)
Most Common Occupations - Sales and related occupations (%)
Most Common Occupations - Office and administrative support occupations (%)
Most Common Occupations - Natural resources, construction, and maintenance occupations (%)
Most Common Occupations - Farming, fishing, and forestry occupations (%)
Most Common Occupations - Construction and extraction occupations (%)
Most Common Occupations - Installation, maintenance, and repair occupations (%)
Most Common Occupations - Production, transportation, and material moving occupations (%)
Most Common Occupations - Production occupations (%)
Most Common Occupations - Transportation occupations (%)
Most Common Occupations - Material moving occupations (%)
People in Group quarters - Institutionalized population (%)
People in Group quarters - Correctional institutions (%)
People in Group quarters - Federal prisons and detention centers (%)
People in Group quarters - Halfway houses (%)
People in Group quarters - Local jails and other confinement facilities (including police lockups) (%)
People in Group quarters - Military disciplinary barracks (%)
People in Group quarters - State prisons (%)
People in Group quarters - Other types of correctional institutions (%)
People in Group quarters - Nursing homes (%)
People in Group quarters - Hospitals/wards, hospices, and schools for the handicapped (%)
People in Group quarters - Hospitals/wards and hospices for chronically ill (%)
People in Group quarters - Hospices or homes for chronically ill (%)
People in Group quarters - Military hospitals or wards for chronically ill (%)
People in Group quarters - Other hospitals or wards for chronically ill (%)
People in Group quarters - Hospitals or wards for drug/alcohol abuse (%)
People in Group quarters - Mental (Psychiatric) hospitals or wards (%)
People in Group quarters - Schools, hospitals, or wards for the mentally retarded (%)
People in Group quarters - Schools, hospitals, or wards for the physically handicapped (%)
People in Group quarters - Institutions for the deaf (%)
People in Group quarters - Institutions for the blind (%)
People in Group quarters - Orthopedic wards and institutions for the physically handicapped (%)
People in Group quarters - Wards in general hospitals for patients who have no usual home elsewhere (%)
People in Group quarters - Wards in military hospitals for patients who have no usual home elsewhere (%)
People in Group quarters - Juvenile institutions (%)
People in Group quarters - Long-term care (%)
People in Group quarters - Homes for abused, dependent, and neglected children (%)
People in Group quarters - Residential treatment centers for emotionally disturbed children (%)
People in Group quarters - Training schools for juvenile delinquents (%)
People in Group quarters - Short-term care, detention or diagnostic centers for delinquent children (%)
People in Group quarters - Type of juvenile institution unknown (%)
People in Group quarters - Noninstitutionalized population (%)
People in Group quarters - College dormitories (includes college quarters off campus) (%)
People in Group quarters - Military quarters (%)
People in Group quarters - On base (%)
People in Group quarters - Barracks, unaccompanied personnel housing (UPH), (Enlisted/Officer), ;and similar group living quarters for military personnel (%)
People in Group quarters - Transient quarters for temporary residents (%)
People in Group quarters - Military ships (%)
People in Group quarters - Group homes (%)
People in Group quarters - Homes or halfway houses for drug/alcohol abuse (%)
People in Group quarters - Homes for the mentally ill (%)
People in Group quarters - Homes for the mentally retarded (%)
People in Group quarters - Homes for the physically handicapped (%)
People in Group quarters - Other group homes (%)
People in Group quarters - Religious group quarters (%)
People in Group quarters - Dormitories (%)
People in Group quarters - Agriculture workers' dormitories on farms (%)
People in Group quarters - Job Corps and vocational training facilities (%)
People in Group quarters - Other workers' dormitories (%)
People in Group quarters - Crews of maritime vessels (%)
People in Group quarters - Other nonhousehold living situations (%)
People in Group quarters - Other noninstitutional group quarters (%)
Residents speaking English at home (%)
Residents speaking English at home - Born in the United States (%)
Residents speaking English at home - Native, born elsewhere (%)
Residents speaking English at home - Foreign born (%)
Residents speaking Spanish at home (%)
Residents speaking Spanish at home - Born in the United States (%)
Residents speaking Spanish at home - Native, born elsewhere (%)
Residents speaking Spanish at home - Foreign born (%)
Residents speaking other language at home (%)
Residents speaking other language at home - Born in the United States (%)
Residents speaking other language at home - Native, born elsewhere (%)
Residents speaking other language at home - Foreign born (%)
Class of Workers - Employee of private company (%)
Class of Workers - Self-employed in own incorporated business (%)
Class of Workers - Private not-for-profit wage and salary workers (%)
Class of Workers - Local government workers (%)
Class of Workers - State government workers (%)
Class of Workers - Federal government workers (%)
Class of Workers - Self-employed workers in own not incorporated business and Unpaid family workers (%)
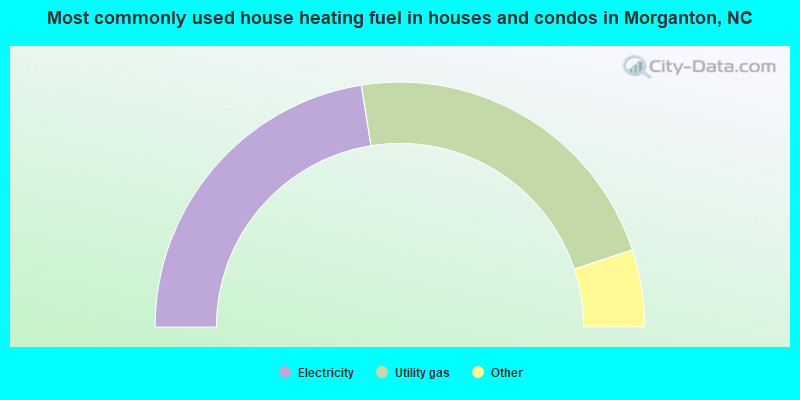
House heating fuel used in houses and condos - Utility gas (%)
House heating fuel used in houses and condos - Bottled, tank, or LP gas (%)
House heating fuel used in houses and condos - Electricity (%)
House heating fuel used in houses and condos - Fuel oil, kerosene, etc. (%)
House heating fuel used in houses and condos - Coal or coke (%)
House heating fuel used in houses and condos - Wood (%)
House heating fuel used in houses and condos - Solar energy (%)
House heating fuel used in houses and condos - Other fuel (%)
House heating fuel used in houses and condos - No fuel used (%)
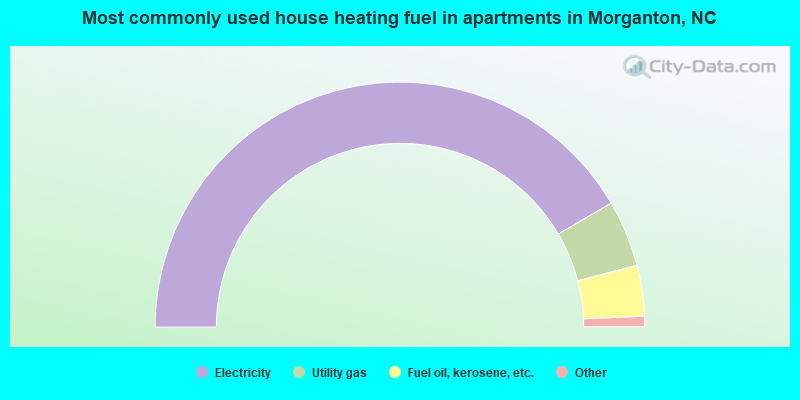
House heating fuel used in apartments - Utility gas (%)
House heating fuel used in apartments - Bottled, tank, or LP gas (%)
House heating fuel used in apartments - Electricity (%)
House heating fuel used in apartments - Fuel oil, kerosene, etc. (%)
House heating fuel used in apartments - Coal or coke (%)
House heating fuel used in apartments - Wood (%)
House heating fuel used in apartments - Solar energy (%)
House heating fuel used in apartments - Other fuel (%)
House heating fuel used in apartments - No fuel used (%)
Armed forces status - In Armed Forces (%)
Armed forces status - Civilian (%)
Armed forces status - Civilian - Veteran (%)
Armed forces status - Civilian - Nonveteran (%)
Fatal accidents locations in years 2005-2021
Fatal accidents locations in 2005
Fatal accidents locations in 2006
Fatal accidents locations in 2007
Fatal accidents locations in 2008
Fatal accidents locations in 2009
Fatal accidents locations in 2010
Fatal accidents locations in 2011
Fatal accidents locations in 2012
Fatal accidents locations in 2013
Fatal accidents locations in 2014
Fatal accidents locations in 2015
Fatal accidents locations in 2016
Fatal accidents locations in 2017
Fatal accidents locations in 2018
Fatal accidents locations in 2019
Fatal accidents locations in 2020
Fatal accidents locations in 2021
Alcohol use - People drinking some alcohol every month (%)
Alcohol use - People not drinking at all (%)
Alcohol use - Average days/month drinking alcohol
Alcohol use - Average drinks/week
Alcohol use - Average days/year people drink much
Audiometry - Average condition of hearing (%)
Audiometry - People that can hear a whisper from across a quiet room (%)
Audiometry - People that can hear normal voice from across a quiet room (%)
Audiometry - Ears ringing, roaring, buzzing (%)
Audiometry - Had a job exposure to loud noise (%)
Audiometry - Had off-work exposure to loud noise (%)
Blood Pressure & Cholesterol - Has high blood pressure (%)
Blood Pressure & Cholesterol - Checking blood pressure at home (%)
Blood Pressure & Cholesterol - Frequently checking blood cholesterol (%)
Blood Pressure & Cholesterol - Has high cholesterol level (%)
Consumer Behavior - Money monthly spent on food at supermarket/grocery store
Consumer Behavior - Money monthly spent on food at other stores
Consumer Behavior - Money monthly spent on eating out
Consumer Behavior - Money monthly spent on carryout/delivered foods
Consumer Behavior - Income spent on food at supermarket/grocery store (%)
Consumer Behavior - Income spent on food at other stores (%)
Consumer Behavior - Income spent on eating out (%)
Consumer Behavior - Income spent on carryout/delivered foods (%)
Current Health Status - General health condition (%)
Current Health Status - Blood donors (%)
Current Health Status - Has blood ever tested for HIV virus (%)
Current Health Status - Left-handed people (%)
Dermatology - People using sunscreen (%)
Diabetes - Diabetics (%)
Diabetes - Had a blood test for high blood sugar (%)
Diabetes - People taking insulin (%)
Diet Behavior & Nutrition - Diet health (%)
Diet Behavior & Nutrition - Milk product consumption (# of products/month)
Diet Behavior & Nutrition - Meals not home prepared (#/week)
Diet Behavior & Nutrition - Meals from fast food or pizza place (#/week)
Diet Behavior & Nutrition - Ready-to-eat foods (#/month)
Diet Behavior & Nutrition - Frozen meals/pizza (#/month)
Drug Use - People that ever used marijuana or hashish (%)
Drug Use - Ever used hard drugs (%)
Drug Use - Ever used any form of cocaine (%)
Drug Use - Ever used heroin (%)
Drug Use - Ever used methamphetamine (%)
Health Insurance - People covered by health insurance (%)
Kidney Conditions-Urology - Avg. # of times urinating at night
Medical Conditions - People with asthma (%)
Medical Conditions - People with anemia (%)
Medical Conditions - People with psoriasis (%)
Medical Conditions - People with overweight (%)
Medical Conditions - Elderly people having difficulties in thinking or remembering (%)
Medical Conditions - People who ever received blood transfusion (%)
Medical Conditions - People having trouble seeing even with glass/contacts (%)
Medical Conditions - People with arthritis (%)
Medical Conditions - People with gout (%)
Medical Conditions - People with congestive heart failure (%)
Medical Conditions - People with coronary heart disease (%)
Medical Conditions - People with angina pectoris (%)
Medical Conditions - People who ever had heart attack (%)
Medical Conditions - People who ever had stroke (%)
Medical Conditions - People with emphysema (%)
Medical Conditions - People with thyroid problem (%)
Medical Conditions - People with chronic bronchitis (%)
Medical Conditions - People with any liver condition (%)
Medical Conditions - People who ever had cancer or malignancy (%)
Mental Health - People who have little interest in doing things (%)
Mental Health - People feeling down, depressed, or hopeless (%)
Mental Health - People who have trouble sleeping or sleeping too much (%)
Mental Health - People feeling tired or having little energy (%)
Mental Health - People with poor appetite or overeating (%)
Mental Health - People feeling bad about themself (%)
Mental Health - People who have trouble concentrating on things (%)
Mental Health - People moving or speaking slowly or too fast (%)
Mental Health - People having thoughts they would be better off dead (%)
Oral Health - Average years since last visit a dentist
Oral Health - People embarrassed because of mouth (%)
Oral Health - People with gum disease (%)
Oral Health - General health of teeth and gums (%)
Oral Health - Average days a week using dental floss/device
Oral Health - Average days a week using mouthwash for dental problem
Oral Health - Average number of teeth
Pesticide Use - Households using pesticides to control insects (%)
Pesticide Use - Households using pesticides to kill weeds (%)
Physical Activity - People doing vigorous-intensity work activities (%)
Physical Activity - People doing moderate-intensity work activities (%)
Physical Activity - People walking or bicycling (%)
Physical Activity - People doing vigorous-intensity recreational activities (%)
Physical Activity - People doing moderate-intensity recreational activities (%)
Physical Activity - Average hours a day doing sedentary activities
Physical Activity - Average hours a day watching TV or videos
Physical Activity - Average hours a day using computer
Physical Functioning - People having limitations keeping them from working (%)
Physical Functioning - People limited in amount of work they can do (%)
Physical Functioning - People that need special equipment to walk (%)
Physical Functioning - People experiencing confusion/memory problems (%)
Physical Functioning - People requiring special healthcare equipment (%)
Prescription Medications - Average number of prescription medicines taking
Preventive Aspirin Use - Adults 40+ taking low-dose aspirin (%)
Reproductive Health - Vaginal deliveries (%)
Reproductive Health - Cesarean deliveries (%)
Reproductive Health - Deliveries resulted in a live birth (%)
Reproductive Health - Pregnancies resulted in a delivery (%)
Reproductive Health - Women breastfeeding newborns (%)
Reproductive Health - Women that had a hysterectomy (%)
Reproductive Health - Women that had both ovaries removed (%)
Reproductive Health - Women that have ever taken birth control pills (%)
Reproductive Health - Women taking birth control pills (%)
Reproductive Health - Women that have ever used Depo-Provera or injectables (%)
Reproductive Health - Women that have ever used female hormones (%)
Sexual Behavior - People 18+ that ever had sex (vaginal, anal, or oral) (%)
Sexual Behavior - Males 18+ that ever had vaginal sex with a woman (%)
Sexual Behavior - Males 18+ that ever performed oral sex on a woman (%)
Sexual Behavior - Males 18+ that ever had anal sex with a woman (%)
Sexual Behavior - Males 18+ that ever had any sex with a man (%)
Sexual Behavior - Females 18+ that ever had vaginal sex with a man (%)
Sexual Behavior - Females 18+ that ever performed oral sex on a man (%)
Sexual Behavior - Females 18+ that ever had anal sex with a man (%)
Sexual Behavior - Females 18+ that ever had any kind of sex with a woman (%)
Sexual Behavior - Average age people first had sex
Sexual Behavior - Average number of female sex partners in lifetime (males 18+)
Sexual Behavior - Average number of female vaginal sex partners in lifetime (males 18+)
Sexual Behavior - Average age people first performed oral sex on a woman (18+)
Sexual Behavior - Average number of woman performed oral sex on in lifetime (18+)
Sexual Behavior - Average number of male sex partners in lifetime (males 18+)
Sexual Behavior - Average number of male anal sex partners in lifetime (males 18+)
Sexual Behavior - Average age people first performed oral sex on a man (18+)
Sexual Behavior - Average number of male oral sex partners in lifetime (18+)
Sexual Behavior - People using protection when performing oral sex (%)
Sexual Behavior - Average number of times people have vaginal or anal sex a year
Sexual Behavior - People having sex without condom (%)
Sexual Behavior - Average number of male sex partners in lifetime (females 18+)
Sexual Behavior - Average number of male vaginal sex partners in lifetime (females 18+)
Sexual Behavior - Average number of female sex partners in lifetime (females 18+)
Sexual Behavior - Circumcised males 18+ (%)
Sleep Disorders - Average hours sleeping at night
Sleep Disorders - People that has trouble sleeping (%)
Smoking-Cigarette Use - People smoking cigarettes (%)
Taste & Smell - People 40+ having problems with smell (%)
Taste & Smell - People 40+ having problems with taste (%)
Taste & Smell - People 40+ that ever had wisdom teeth removed (%)
Taste & Smell - People 40+ that ever had tonsils teeth removed (%)
Taste & Smell - People 40+ that ever had a loss of consciousness because of a head injury (%)
Taste & Smell - People 40+ that ever had a broken nose or other serious injury to face or skull (%)
Taste & Smell - People 40+ that ever had two or more sinus infections (%)
Weight - Average height (inches)
Weight - Average weight (pounds)
Weight - Average BMI
Weight - People that are obese (%)
Weight - People that ever were obese (%)
Weight - People trying to lose weight (%)
Officers per 1,000 residents here:
3.37North Carolina average:
2.27
Latest news from Morganton, NC collected exclusively by city-data.com from local newspapers, TV, and radio stations
Ancestries: American (28.7%), Irish (5.9%), German (5.8%), English (5.2%), Scotch-Irish (2.0%).
Current Local Time:
Land area: 18.2 square miles.
Population density: 969 people per square mile (low).
1,828 residents are foreign born (8.6% Latin America ).
This city:
10.5%North Carolina:
8.3%
Median real estate property taxes paid for housing units with mortgages in 2022: $1,825 (0.7%)Median real estate property taxes paid for housing units with no mortgage in 2022: $1,497 (0.8%)
Nearest city with pop. 50,000+: Gastonia, NC
Nearest city with pop. 200,000+: Charlotte, NC
Nearest city with pop. 1,000,000+: Philadelphia, PA
Nearest cities:
Latitude: 35.74 N, Longitude: 81.69 W
Daytime population change due to commuting: +12,347 (+70.7%)Workers who live and work in this city: 5,067 (67.4%)
Single-family new house construction building permits:
2022: 12 buildings , average cost: $150,5002021: 13 buildings , average cost: $150,5002020: 11 buildings , average cost: $150,5002019: 11 buildings , average cost: $150,5002018: 10 buildings , average cost: $150,4002017: 9 buildings , average cost: $150,7002016: 7 buildings , average cost: $149,6002015: 11 buildings , average cost: $152,9002014: 9 buildings , average cost: $139,0002013: 7 buildings , average cost: $216,2002012: 7 buildings , average cost: $100,1002011: 12 buildings , average cost: $141,9002010: 13 buildings , average cost: $117,6002009: 12 buildings , average cost: $117,6002008: 8 buildings , average cost: $153,5002007: 34 buildings , average cost: $142,3002006: 52 buildings , average cost: $149,7002005: 54 buildings , average cost: $97,7002004: 48 buildings , average cost: $97,7002003: 51 buildings , average cost: $115,6002002: 70 buildings , average cost: $111,3002001: 61 buildings , average cost: $111,3002000: 61 buildings , average cost: $111,3001999: 19 buildings , average cost: $128,2001998: 17 buildings , average cost: $128,2001997: 16 buildings , average cost: $128,200Unemployment in December 2023: Here:
2.9%North Carolina:
3.2%
Population change in the 1990s: +1,402 (+8.8%).
Most common occupations in Morganton, NC (%)
Both Males Females
Other production occupations, including supervisors (6.5%)
Other sales and related occupations, including supervisors (4.7%)
Preschool, kindergarten, elementary, and middle school teachers (4.2%)
Assemblers and fabricators (3.7%)
Other management occupations, except farmers and farm managers (3.7%)
Other office and administrative support workers, including supervisors (3.5%)
Retail sales workers, except cashiers (3.4%)
Other production occupations, including supervisors (7.6%)
Other sales and related occupations, including supervisors (5.9%)
Electrical equipment mechanics and other installation, maintenance, and repair workers, including supervisors (4.7%)
Metal workers and plastic workers (4.2%)
Assemblers and fabricators (4.0%)
Woodworkers (4.0%)
Driver/sales workers and truck drivers (3.9%)
Preschool, kindergarten, elementary, and middle school teachers (8.5%)
Other office and administrative support workers, including supervisors (7.0%)
Other production occupations, including supervisors (5.2%)
Other management occupations, except farmers and farm managers (4.3%)
Registered nurses (4.1%)
Counselors, social workers, and other community and social service specialists (3.7%)
Nursing, psychiatric, and home health aides (3.4%)
Tornado activity:
Morganton-area historical tornado activity is slightly below North Carolina state average. It is 29% smaller than the overall U.S. average.
On 5/5/1989, a category F4 (max. wind speeds 207-260 mph) tornado 15.9 miles away from the Morganton city center killed 4 people and injured 52 people and caused between $5,000,000 and $50,000,000 in damages.
On 5/7/1998, a category F4 tornado 19.6 miles away from the city center injured 2 people and caused $1 million in damages.
Earthquake activity:
Morganton-area historical earthquake activity is significantly above North Carolina state average. It is 5% greater than the overall U.S. average. On 8/9/2020 at 12:07:37, a magnitude 5.1 (5.1 MW, Depth: 4.7 mi, Class: Moderate, Intensity: VI - VII) earthquake occurred 60.7 miles away from the city center On 8/23/2011 at 17:51:04, a magnitude 5.8 (5.8 MW, Depth: 3.7 mi) earthquake occurred 256.3 miles away from the city center On 8/2/1974 at 08:52:09, a magnitude 4.9 (4.3 MB, 4.9 LG, Class: Light, Intensity: IV - V) earthquake occurred 137.0 miles away from Morganton center On 7/27/1980 at 18:52:21, a magnitude 5.2 (5.1 MB, 4.7 MS, 5.0 UK, 5.2 UK) earthquake occurred 210.9 miles away from the city center On 11/30/1973 at 07:48:41, a magnitude 4.7 (4.7 MB, 4.6 ML) earthquake occurred 127.4 miles away from Morganton center On 11/23/2006 at 10:42:57, a magnitude 4.3 (4.3 MB) earthquake occurred 99.1 miles away from the city center Magnitude types: regional Lg-wave magnitude (LG), body-wave magnitude (MB), local magnitude (ML), surface-wave magnitude (MS), moment magnitude (MW) Natural disasters: The number of natural disasters in Burke County (14) is near the US average (15).Major Disasters (Presidential) Declared: 10Emergencies Declared: 3Floods: 4, Hurricanes: 3, Storms: 3, Winter Storms: 2, Blizzard: 1, Drought: 1, Ice Storm: 1, Landslide: 1, Mudslide: 1, Snowfall: 1, Tornado: 1, Tropical Storm: 1, Other: 1 (Note: some incidents may be assigned to more than one category). Hospitals in Morganton: BROUGHTON HOSP (1000 S STERLING ST) BROUGHTON HOSPITAL-MEDICAL UNIT (1000 S STERLING ST) CMC-BLUE RIDGE (Proprietary, provides emergency services, 2201 S STERLING ST) HARTLAND GROUP HOME (2307 HARTLAND ROAD) J. IVERSON RIDDLE DEVELOPMENTAL CENTER (300 ENOLA ROAD) LOWER CREEK GROUP HOME (3256 PLAYMORE BEACH RD) PLAYMORE GROUP HOME (3252 PLAYMORE BEACH ROAD) SCI-BURKE ICF/MR GROUP HOME (101 STEPHENS DRIVE) WESTERN CAROLINA CENTER HOSPITAL (300 ENOLA RD) Nursing Homes in Morganton: BROUGHTON HOSPITAL NF (1000 SOUTH STERLING ST) FOOTHILLS NURSING CENTER (109 FOOTHILLS DR) GRACE HEIGHTS HEALTH AND REHAB CTR (109 FOOTHILLS DRIVE) GRACE RIDGE (500 LENOIR RD) MAGNOLIA LANE NURSING AND REHABILITATION CENTER (107 MAGNOLIA DR) Dialysis Facilities in Morganton: BMA OF BURKE COUNTY INC (145 WEST PARKER ROAD)
College/University in Morganton: Western Piedmont Community College Full-time enrollment: 2,205; Location: 1001 Burkemont Ave; Public; Website: www.wpcc.edu)
Other colleges/universities with over 2000 students near Morganton:
Caldwell Community College and Technical Institute (about 15 miles; Hudson, NC ; Full-time enrollment: 3,636)
Catawba Valley Community College (about 23 miles; Hickory, NC ; FT enrollment: 3,785)
Isothermal Community College (about 31 miles; Spindale, NC ; FT enrollment: 2,165)
Appalachian State University (about 33 miles; Boone, NC ; FT enrollment: 17,362)
Cleveland Community College (about 35 miles; Shelby, NC ; FT enrollment: 2,541)
Gardner-Webb University (about 35 miles; Boiling Springs, NC ; FT enrollment: 4,241)
Wilkes Community College (about 40 miles; Wilkesboro, NC ; FT enrollment: 2,292)
Public high schools in Morganton:
Private high school in Morganton: SILVERCREEK ADVENTIST SCHOOL Students: 33, Location: 2195 JAMESTOWN RD, Grades: KG-9)
Biggest public elementary/middle schools in Morganton: NEW DIMENSIONS Location: 550 LENOIR ROAD, Grades: KG-8, Charter school )TABLE ROCK MIDDLE Location: 1585 NC 126, Grades: 6-8)CHESTERFIELD ELEMENTARY Location: 2142 PAX HILL ROAD, Grades: PK-5)FOREST HILL ELEMENTARY Location: 304 ANN STREET, Grades: PK-5)
GLEN ALPINE ELEMENTARY Location: 302 LONDON STREET, Grades: PK-5)MOUNTAIN CREST ELEMENTARY Location: 201 TENNESSEE STREET, Grades: PK-5)
MULL ELEMENTARY Location: 1140 OLD NC 18 SOUTH, Grades: PK-5)
OAK HILL ELEMENTARY Location: 2363 NC 181, Grades: PK-5)SALEM ELEMENTARY Location: 1329 SALEM ROAD, Grades: PK-5)LIBERTY MIDDLE Location: 529 ENOLA ROAD, Grades: 6-8)
Private elementary/middle school in Morganton: MORGANTON DAY SCHOOL Students: 102, Location: 305 W CONCORD ST, Grades: KG-8)
See full list of schools located in Morganton Library in Morganton: BURKE COUNTY PUBLIC LIBRARY Operating income: $1,171,362; Location: 204 SOUTH KING STREET; 112,314 books ; 4,697 audio materials ; 2,875 video materials ; 56 state licensed databases ; 141 print serial subscriptions )
User-submitted facts and corrections:
Broadcast TV stations WSOC-TV Channel 9 and WAXN-TV Channel 64 in Charlotte, Both owned by COX Broadcasting located at 1901 N. Tryon Street, Charlotte, NC 28206
Notable locations in Morganton: (A) , Morganton Plaza (B) , Magnolia Plaza (C) , Burkeley Square (D) . Display/hide their locations on the map
Shopping Center: (1) . Display/hide its location on the map
Churches in Morganton include: (A) , Saint Marys Mission Church (B) . Display/hide their locations on the map
Streams, rivers, and creeks: (A) , Canoe Creek (B) , Silver Creek (C) , Hunting Creek (D) . Display/hide their locations on the map
Parks in Morganton include: (1) , Mountain View Recreation Center (2) , Freedom Park (3) , Collett Street Recreation Center (4) , M L King Park (5) , Cascade Park (6) . Display/hide their locations on the map
Tourist attractions: (1) , Historic Burke Foundation Inc (Museums; 102 East Union Street) (2) , North Carolina Wildlife Resources Commission (Recreation Areas; 5154 Western Avenue) (3) , Drexel Community Fair (Amusement & Theme Parks; 700 South Main Street) (4) , Burke County Travel & Tourism Commission (102 East Union Street) (5) . Display/hide their approximate locations on the map
Hotels: (1) , Comfort Inn Suites (1273 Burkemont Avenue) (2) , Comfort Inn & Suites (1273 Burkmount Avenue) (3) , Holiday Inn (2400 South Sterling Street) (4) , Days Inn (Highway I 40 Highway) (5) , Eagle Motel (West US70 Highway) (6) , Economy Inn (1301 Bethel Road) (7) . Display/hide their approximate locations on the map
Courts: (1) , Burke County - Clerk Of Court- Juvenile Hospitalization (201 South Green Street) (2) , Burke County - Clerk Of Court- Administrative (201 South Green Street) (3) , Burke County - Clerk Of Court- Child Support (201 South Green Street) (4) , Burke County - District Court Judges (201 South Green Street) (5) , Burke County - Clerk Of Court- Criminal (201 South Green Street) (6) , Burke County - Clerk Of Court- Estates (201 South Green Street) (7) , Burke County - Clerk Of Court- Bookkeeping (201 South Green Street) (8) , Burke County - Clerk Of Court- Juvenile (201 South Green Street) (9) . Display/hide their approximate locations on the map
Birthplace of: Sam Ervin - Democratic Senator, Billy Joe Patton - Amateur golfer, Leon Johnson - 2005 NFL player (San Diego Chargers, born : Jul 13, 1974), Ava Ohlgren - Swimmer, Chris Moore - College basketball player (Char. Southern Buccaneers), Donald Brown (Canadian football) - Player of and football, Greg Holland (baseball) - Baseball player, Leon Johnson (American football) - Football player, Susan C. Fisher - Politician.
Burke County has a predicted average indoor radon screening level between 2 and 4 pCi/L (pico curies per liter) - Moderate Potential Drinking water stations with addresses in Morganton and their reported violations in the past:
STEEL CREEK PARK (Population served: 500, Groundwater):
Past monitoring violations:
3 routine major monitoring violations
Population served: 385, Purch surface water):
Past health violations:
MCL, Average - Between JUL-2008 and SEP-2008, Contaminant: Total Haloacetic Acids (HAA5). Follow-up actions: St AO (w/o penalty) issued (JUL-17-2008), St Public Notif requested (FEB-19-2009), St Formal NOV issued (FEB-19-2009), St Compliance achieved (DEC-31-2009)
MCL, Average - Between APR-2008 and JUN-2008, Contaminant: Total Haloacetic Acids (HAA5). Follow-up actions: St AO (w/o penalty) issued (JUL-17-2008)
MCL, Average - Between JAN-2008 and MAR-2008, Contaminant: Total Haloacetic Acids (HAA5). Follow-up actions: St AO (w/o penalty) issued (JUL-17-2008), St Formal NOV issued (JUL-17-2008), St Public Notif requested (JUL-17-2008), St Compliance achieved (DEC-31-2009)
Population served: 240, Purch surface water):
Past monitoring violations:
Initial Tap Sampling for Pb and Cu - In JAN-01-2005, Contaminant: Lead and Copper Rule. Follow-up actions: St Public Notif requested (AUG-01-2005), St Formal NOV issued (AUG-18-2005), St Public Notif received (APR-25-2006), St Compliance achieved (JUL-01-2006)
Initial Tap Sampling for Pb and Cu - In JAN-01-2004, Contaminant: Lead and Copper Rule. Follow-up actions: St Public Notif requested (AUG-19-2004), St Formal NOV issued (AUG-19-2004), St Compliance achieved (JUN-30-2006)
Population served: 75, Groundwater):
Past monitoring violations:
4 routine major monitoring violations
One regular monitoring violation
Population served: 75, Groundwater):
Past monitoring violations:
One routine major monitoring violation
Population served: 50, Groundwater):
Past monitoring violations:
6 routine major monitoring violations
3 regular monitoring violations
Population served: 47, Groundwater):
Past monitoring violations:
3 routine major monitoring violations
One regular monitoring violation
Address: ATTN: KATHY & MIKE ROGERS Population served: 30, Groundwater):
Past monitoring violations:
One routine major monitoring violation
Drinking water stations with addresses in Morganton that have no violations reported:
BURKE CO-ENOLA HENRY RIVER (Population served: 2,772, Primary Water Source Type: Purch surface water)
BURKE COUNTY OMARA (Population served: 350, Primary Water Source Type: Purch surface water)
BURKE CO-MINERAL SPRINGS (Population served: 310, Primary Water Source Type: Purch surface water)
LINVILLE SHORES CAMPGROUND (Population served: 163, Primary Water Source Type: Groundwater)
HORSESHOE BEND CAMPGROUND (Population served: 64, Primary Water Source Type: Groundwater)
Average household size: This city:
2.4 peopleNorth Carolina:
2.5 people
Percentage of family households: This city:
61.2%Whole state:
66.7%
Percentage of households with unmarried partners: This city:
5.7%Whole state:
5.9%
Likely homosexual households (counted as self-reported same-sex unmarried-partner households)
Lesbian couples: 0.5% of all households Gay men: 0.3% of all households
People in group quarters in Morganton in 2010:
323 people in residential treatment centers for adults
294 people in nursing facilities/skilled-nursing facilities
200 people in local jails and other municipal confinement facilities
176 people in other noninstitutional facilities
131 people in mental (psychiatric) hospitals and psychiatric units in other hospitals
88 people in residential schools for people with disabilities
21 people in emergency and transitional shelters (with sleeping facilities) for people experiencing homelessness
15 people in group homes intended for adults
3 people in residential treatment centers for juveniles (non-correctional)
People in group quarters in Morganton in 2000:
478 people in mental (psychiatric) hospitals or wards
359 people in schools, hospitals, or wards for the intellectually disabled
302 people in nursing homes
235 people in other noninstitutional group quarters
61 people in hospitals or wards for drug/alcohol abuse
49 people in local jails and other confinement facilities (including police lockups)
8 people in homes or halfway houses for drug/alcohol abuse
8 people in other group homes
7 people in homes for the mentally ill
6 people in other workers' dormitories
3 people in other nonhousehold living situations
Banks with most branches in Morganton (2011 data):
Wells Fargo Bank, National Association: Morganton Plaza Branch, Time Payment Branch, Morganton Main Branch. Info updated 2011/04/05: Bank assets: $1,161,490.0 mil, Deposits: $905,653.0 mil, headquarters in Sioux Falls, SD, positive income , 6395 total offices , Holding Company: Wells Fargo & Company
SunTrust Bank: South Sterling Branch 199 at 612 South Sterling Street, branch established on 1968/12/05; Morganton Main Branch 198 at 300 North Green Street, branch established on 1962/11/09. Info updated 2010/05/27: Bank assets: $171,291.7 mil, Deposits: $129,833.2 mil, headquarters in Atlanta, GA, positive income , Commercial Lending Specialization, 1716 total offices , Holding Company: Suntrust Banks, Inc.
First-Citizens Bank & Trust Company: West Morganton Branch at 204 Carbon City Road, branch established on 1995/06/19; Morganton Branch at 217 North Sterling Street, branch established on 1991/07/09. Info updated 2011/10/11: Bank assets: $20,566.4 mil, Deposits: $17,596.8 mil, headquarters in Raleigh, NC, positive income , Commercial Lending Specialization, 433 total offices , Holding Company: First Citizens Bancshares, Inc.
Morganton Federal Savings and Loan Association: Morganton Federal Savings And Loan A at 100 South King Street, branch established on 1903/01/01. Info updated 2011/07/21: Bank assets: $84.6 mil, Deposits: $56.7 mil, local headquarters , negative income in the last year , Commercial Lending Specialization, 1 total offices
Branch Banking and Trust Company: Morganton Main Branch at 105 Avery Avenue, branch established on 1933/01/01. Info updated 2010/03/29: Bank assets: $168,867.6 mil, Deposits: $127,549.5 mil, headquarters in Winston Salem, NC, positive income , Commercial Lending Specialization, 1793 total offices , Holding Company: Bb&T Corporation
TD Bank, National Association: Morganton Branch at 401 South Sterling Street, branch established on 2002/06/10. Info updated 2010/10/04: Bank assets: $188,912.6 mil, Deposits: $153,149.8 mil, headquarters in Wilmington, DE, positive income , 1314 total offices , Holding Company: Toronto-Dominion Bank, The
Bank of Granite: Morganton Office at 201 East Meeting Street, branch established on 1989/07/10. Info updated 2006/11/03: Bank assets: $753.5 mil, Deposits: $688.5 mil, headquarters in Granite Falls, NC, positive income , Commercial Lending Specialization, 18 total offices , Holding Company: Fnb United Corp.
Bank of America, National Association: Morganton Main Branch at 100 North Green Street, branch established on 1967/06/29. Info updated 2009/11/18: Bank assets: $1,451,969.3 mil, Deposits: $1,077,176.8 mil, headquarters in Charlotte, NC, positive income , 5782 total offices , Holding Company: Bank Of America Corporation
Carter Bank & Trust: West Morganton Branch at 301 Carbon City Road, branch established on 2001/02/05. Info updated 2007/02/23: Bank assets: $3,970.4 mil, Deposits: $3,610.0 mil, headquarters in Martinsville, VA, positive income , Commercial Lending Specialization, 123 total offices
For population 15 years and over in Morganton:
Never married: 34.1%Now married: 42.5%Separated: 4.7%Widowed: 6.1%Divorced: 12.5% For population 25 years and over in Morganton:
High school or higher: 76.7%Bachelor's degree or higher: 24.0%Graduate or professional degree: 10.3%Unemployed: 3.6%Mean travel time to work (commute): 20.1 minutes
Education Gini index (Inequality in education) Here:
17.1North Carolina average:
11.7
Religion statistics for Morganton, NC (based on Burke County data)
Religion Adherents Congregations Evangelical Protestant 41,460 141 Mainline Protestant 9,782 43 Black Protestant 2,006 12 Other 1,153 5 Catholic 1,023 1 None 35,717 -
Source: Clifford Grammich, Kirk Hadaway, Richard Houseal, Dale E.Jones, Alexei Krindatch, Richie Stanley and Richard H.Taylor. 2012. 2010 U.S.Religion Census: Religious Congregations & Membership Study. Association of Statisticians of American Religious Bodies. Jones, Dale E., et al. 2002. Congregations and Membership in the United States 2000. Nashville, TN: Glenmary Research Center. Graphs represent county-level data
Food Environment Statistics: Number of grocery stores : 20Burke County :
2.25 / 10,000 pop.State :
2.05 / 10,000 pop.
Number of convenience stores (no gas) : 10Here :
1.13 / 10,000 pop.North Carolina :
0.92 / 10,000 pop.
Number of convenience stores (with gas) : 49Here :
5.52 / 10,000 pop.North Carolina :
4.75 / 10,000 pop.
Number of full-service restaurants : 46Burke County :
5.18 / 10,000 pop.State :
7.57 / 10,000 pop.
Adult diabetes rate : This county :
10.2%North Carolina :
9.8%
Adult obesity rate : Burke County :
27.5%North Carolina :
28.3%
Low-income preschool obesity rate : This county :
16.7%State :
15.6%
Health and Nutrition: Healthy diet rate : Morganton:
47.0%North Carolina:
48.9%
Average overall health of teeth and gums : People feeling badly about themselves : Here:
22.7%North Carolina:
20.7%
People not drinking alcohol at all : This city:
11.4%North Carolina:
10.7%
Average hours sleeping at night : Overweight people : Morganton:
32.7%North Carolina:
33.7%
General health condition : This city:
52.7%North Carolina:
55.8%
Average condition of hearing : This city:
77.4%North Carolina:
79.7%
More about Health and Nutrition of Morganton, NC Residents
Local government employment and payroll (March 2022)
Function
Full-time employees
Monthly full-time payroll
Average yearly full-time wage
Part-time employees
Monthly part-time payroll
Police Protection - Officers
55 $255,110 $55,660 0 $0 Other and Unallocable
33 $122,747 $44,635 4 $4,542 Sewerage
29 $105,661 $43,722 0 $0 Parks and Recreation
27 $103,770 $46,120 81 $39,669 Other Government Administration
26 $132,490 $61,149 5 $5,480 Firefighters
24 $85,350 $42,675 2 $1,488 Electric Power
23 $102,225 $53,335 1 $264 Streets and Highways
19 $52,131 $32,925 0 $0 Financial Administration
15 $64,128 $51,302 1 $1,506 Solid Waste Management
13 $37,366 $34,492 0 $0 Water Supply
10 $38,216 $45,859 1 $266 Police - Other
6 $26,565 $53,130 0 $0 Judicial and Legal
2 $15,064 $90,384 0 $0
Totals for Government
282 $1,140,822 $48,546 95 $53,214
Morganton government finances - Expenditure in 2021 (per resident):
Current Operations - Electric Utilities: $27,124,000 ($1540.96)
Police Protection: $7,767,000 ($441.26)Miscellaneous Commercial Activities - Other: $4,590,000 ($260.77)Water Utilities: $4,205,000 ($238.89)Parks and Recreation: $3,312,000 ($188.16)Liquor Stores: $2,983,000 ($169.47)Sewerage: $2,746,000 ($156.00)Regular Highways: $1,935,000 ($109.93)Housing and Community Development: $1,575,000 ($89.48)General - Other: $1,393,000 ($79.14)Solid Waste Management: $1,058,000 ($60.11)Central Staff Services: $957,000 ($54.37)Natural Resources - Other: $677,000 ($38.46)Judicial and Legal Services: $75,000 ($4.26)Health - Other: $51,000 ($2.90)Financial Administration: $33,000 ($1.87)General Public Buildings: $16,000 ($0.91)Electric Utilities - Interest on Debt: $4,000 ($0.23)
General - Interest on Debt: $425,000 ($24.14)
Intergovernmental to Local - Other - Health - Other: $13,000 ($0.74)
Other Capital Outlay - Parks and Recreation: $3,887,000 ($220.83)
Police Protection: $531,000 ($30.17)Regular Highways: $321,000 ($18.24)Solid Waste Management: $275,000 ($15.62)Housing and Community Development: $103,000 ($5.85)Natural Resources - Other: $16,000 ($0.91)Total Salaries and Wages: $521,000 ($29.60)
Water Utilities - Interest on Debt: $4,000 ($0.23)
Morganton government finances - Revenue in 2021 (per resident):
Charges - Miscellaneous Commercial Activities: $6,196,000 ($352.01)
Sewerage: $5,938,000 ($337.35)Solid Waste Management: $1,485,000 ($84.37)Parks and Recreation: $419,000 ($23.80)Other: $162,000 ($9.20)Parking Facilities: $9,000 ($0.51)Federal Intergovernmental - General Local Government Support: $44,000 ($2.50)
Local Intergovernmental - General Local Government Support: $466,000 ($26.47)
Miscellaneous - General Revenue - Other: $7,538,000 ($428.25)
Donations From Private Sources: $159,000 ($9.03)Rents: $56,000 ($3.18)Interest Earnings: $39,000 ($2.22)Revenue - Electric Utilities: $29,547,000 ($1678.62)
Water Utilities: $5,952,000 ($338.14)Liquor Stores: $3,628,000 ($206.11)State Intergovernmental - General Local Government Support: $2,284,000 ($129.76)
Highways: $443,000 ($25.17)Tax - Property: $10,734,000 ($609.82)
General Sales and Gross Receipts: $5,259,000 ($298.77)Alcoholic Beverage Sales: $547,000 ($31.08)Motor Vehicle License: $276,000 ($15.68)Occupation and Business License - Other: $133,000 ($7.56)Other Selective Sales: $124,000 ($7.04)Other License: $13,000 ($0.74)
Morganton government finances - Debt in 2021 (per resident):
Long Term Debt - Outstanding Unspecified Public Purpose: $18,321,000 ($1040.85)
Beginning Outstanding - Unspecified Public Purpose: $17,676,000 ($1004.20)Issue, Unspecified Public Purpose: $2,788,000 ($158.39)Retired Unspecified Public Purpose: $2,144,000 ($121.80)
Businesses in Morganton, NC
Name Count Name Count
AT&T 1 Kmart 1 Ace Hardware 1 Little Caesars Pizza 1 Advance Auto Parts 1 Lowe's 1 Arby's 1 Maurices 1 AutoZone 1 McDonald's 2 Bath & Body Works 1 New Balance 1 Blockbuster 1 Nike 3 Burger King 2 Penske 1 CVS 1 Pizza Hut 1 Chevrolet 1 Quality 1 Chick-Fil-A 1 RadioShack 1 Comfort Inn 1 Rite Aid 2 Curves 1 SONIC Drive-In 1 Days Inn 1 Sears 1 Dennys 1 Sleep Inn 1 Domino's Pizza 1 Staples 1 Dunkin Donuts 2 Starbucks 1 FedEx 3 Subway 3 Ford 1 Taco Bell 2 GNC 2 U-Haul 4 H&R Block 1 UPS 7 Hardee's 2 Waffle House 1 Hilton 1 Walmart 1 Honda 1 Wendy's 2 KFC 2
Strongest AM radio stations in Morganton:
WMNC (1430 AM; 3 kW; MORGANTON, NC; Owner: COOPER BROADCASTING COMPANY)
WCIS (760 AM; daytime; 4 kW; MORGANTON, NC; Owner: W.F.M. INCORPORATED)
WHKY (1290 AM; 50 kW; HICKORY, NC; Owner: LONG COMMUNICATIONS, LLC.)
WFGW (1010 AM; 50 kW; BLACK MOUNTAIN, NC; Owner: BLUE RIDGE BROADCASTING CORP.)
WKGX (1080 AM; daytime; 5 kW; LENOIR, NC; Owner: FOOTHILLS RADIO GROUP, LLC)
WWOL (780 AM; daytime; 10 kW; FOREST CITY, NC; Owner: HOLLY SPRINGS BAPTIST BROADCASTING CO., INC.)
WSVM (1490 AM; 1 kW; VALDESE, NC; Owner: GHB OF WAXHAW, INC.)
WLFJ (660 AM; daytime; 50 kW; GREENVILLE, SC; Owner: CLEAR CHANNEL BROADCASTING LICENSES, INC.)
WBT (1110 AM; 50 kW; CHARLOTTE, NC; Owner: JEFFERSON-PILOT COMMUNICATNS CO. OF NORTH CAROLINA)
WXIT (1200 AM; daytime; 10 kW; BLOWING ROCK, NC; Owner: RONDINARO BROADCASTING, INC.)
WBRM (1250 AM; 5 kW; MARION, NC; Owner: WBRM, INC.)
WCSZ (1070 AM; 50 kW; SANS SOUCI, SC; Owner: WHYZ RADIO, L.P.)
WTRU (830 AM; 50 kW; KERNERSVILLE, NC; Owner: TRUTH BROADCASTING CORPORATION)
Strongest FM radio stations in Morganton:
WMNC-FM (92.1 FM; MORGANTON, NC; Owner: COOPER BROADCASTING COMPANY)
WMIT (106.9 FM; BLACK MOUNTAIN, NC; Owner: BLUE RIDGE BROADCASTING CORPORATION)
WNCW (88.7 FM; SPINDALE, NC; Owner: ISOTHERMAL COMMUNITY COLLEGE)
W232AV (94.3 FM; LENOIR, NC; Owner: DAVID TORRES)
W218BW (91.5 FM; LENOIR, NC; Owner: EAST TENNESSEE STATE UNIVERSITY)
WAGI-FM (105.3 FM; GAFFNEY, SC; Owner: GAFFNEY BROADCASTING, INC.)
WECR-FM (102.3 FM; BEECH MOUNTAIN, NC; Owner: RONDINARO BROADCASTING, INC)
WZJS (100.7 FM; BANNER ELK, NC; Owner: HIGHLAND COMMUNICATIONS ASSOCIATES, LLC)
WFHE (90.3 FM; HICKORY, NC; Owner: UNIVERSITY RADIO FOUNDATION, INC.)
WKVS (103.3 FM; LENOIR, NC; Owner: FOOTHILLS RADIO GROUP, LLC)
WTPT (93.3 FM; FOREST CITY, NC; Owner: UPSTATE BROADCASTING, LLC)
W285DG (104.9 FM; BOONE, NC; Owner: CITADEL BROADCASTING COMPANY)
W225AA (92.9 FM; BOONE, NC; Owner: ISOTHERMAL COMMUNITY COLLEGE)
WPEG (97.9 FM; CONCORD, NC; Owner: INFINITY RADIO SUBSIDIARY OPERATIONS INC.)
WHCB (91.5 FM; BRISTOL, TN; Owner: APPALACHIAN EDUC. COMMUNICATION CORP)
WLYT (102.9 FM; HICKORY, NC; Owner: CAPSTAR TX LIMITED PARTNERSHIP)
WNKS (95.1 FM; CHARLOTTE, NC; Owner: INFINITY RADIO SUBSIDIARY OPERATIONS INC.)
WQNQ (104.3 FM; OLD FORT, NC; Owner: CLEAR CHANNEL BROADCASTING LICENSES, INC.)
WETS-FM (89.5 FM; JOHNSON CITY, TN; Owner: EAST TENNESSEE STATE UNIVERSITY)
WXBQ-FM (96.9 FM; BRISTOL, TN; Owner: BRISTOL BROADCASTING COMPANY, INC.)
TV broadcast stations around Morganton:
WBTV (Channel 3; CHARLOTTE, NC; Owner: JEFFERSON-PILOT COMMUNICATIONS/WBTV, INC.)
WCNC-TV (Channel 36; CHARLOTTE, NC; Owner: WCNC-TV, INC.)
WJZY (Channel 46; BELMONT, NC; Owner: WJZY-TV, INC.)
WWWB (Channel 55; ROCK HILL, SC; Owner: WWWB-TV, INC.)
WASV-TV (Channel 62; ASHEVILLE, NC; Owner: MEDIA GENERAL BROADCASTING OF SOUTH CAROLINA HOLDINGS, INC.)
WHKY-TV (Channel 14; HICKORY, NC; Owner: LONG COMMUNICATIONS, LLC.)
WUNE-TV (Channel 17; LINVILLE, NC; Owner: UNIVERSITY OF NORTH CAROLINA)
National Bridge Inventory (NBI) Statistics 95 Number of bridges1,089ft / 332m Total length858,530 Total average daily traffic111,524 Total average daily truck traffic
New bridges - historical statistics
1 1920-1929 4 1930-1939 1 1940-1949 26 1950-1959 8 1960-1969 15 1970-1979 7 1980-1989 9 1990-1999 11 2000-2009 13 2010-2019
See full National Bridge Inventory statistics for Morganton, NC
Home Mortgage Disclosure Act Aggregated Statistics For Year 2009(Based on 3 full and 3 partial tracts) A) FHA, FSA/RHS & VA B) Conventional C) Refinancings D) Home Improvement Loans E) Loans on Dwellings For 5+ Families F) Non-occupant Loans on G) Loans On Manufactured Number Average Value Number Average Value Number Average Value Number Average Value Number Average Value Number Average Value Number Average Value
LOANS ORIGINATED 25 $127,716 66 $124,138 190 $147,181 12 $51,799 1 $196,580 27 $115,809 3 $57,293 APPLICATIONS APPROVED, NOT ACCEPTED 0 $0 4 $132,142 7 $117,539 3 $29,537 1 $51,140 2 $53,610 2 $45,375 APPLICATIONS DENIED 7 $133,720 5 $112,846 68 $138,874 4 $69,255 1 $39,340 6 $115,273 6 $75,123 APPLICATIONS WITHDRAWN 1 $53,500 2 $183,315 39 $140,083 3 $53,180 0 $0 2 $81,875 1 $61,620 FILES CLOSED FOR INCOMPLETENESS 1 $148,890 0 $0 14 $147,498 1 $82,730 0 $0 1 $178,890 1 $15,000
Aggregated Statistics For Year 2008(Based on 3 full and 3 partial tracts) A) FHA, FSA/RHS & VA B) Conventional C) Refinancings D) Home Improvement Loans E) Loans on Dwellings For 5+ Families F) Non-occupant Loans on G) Loans On Manufactured Number Average Value Number Average Value Number Average Value Number Average Value Number Average Value Number Average Value Number Average Value
LOANS ORIGINATED 32 $102,904 83 $134,549 126 $128,727 17 $76,562 4 $1,478,020 27 $120,935 6 $73,543 APPLICATIONS APPROVED, NOT ACCEPTED 1 $48,160 7 $216,536 21 $101,221 1 $22,750 0 $0 5 $219,992 3 $69,023 APPLICATIONS DENIED 5 $120,740 11 $121,553 82 $125,382 14 $60,840 0 $0 8 $93,585 4 $81,092 APPLICATIONS WITHDRAWN 2 $108,835 6 $118,338 50 $116,234 2 $319,420 0 $0 5 $91,140 1 $117,900 FILES CLOSED FOR INCOMPLETENESS 0 $0 0 $0 7 $139,876 0 $0 0 $0 0 $0 0 $0
Aggregated Statistics For Year 2007(Based on 3 full and 3 partial tracts) A) FHA, FSA/RHS & VA B) Conventional C) Refinancings D) Home Improvement Loans E) Loans on Dwellings For 5+ Families F) Non-occupant Loans on G) Loans On Manufactured Number Average Value Number Average Value Number Average Value Number Average Value Number Average Value Number Average Value Number Average Value
LOANS ORIGINATED 15 $112,837 139 $126,686 171 $109,692 23 $33,926 4 $388,010 55 $89,726 5 $76,036 APPLICATIONS APPROVED, NOT ACCEPTED 1 $115,980 18 $117,717 31 $93,041 12 $37,428 0 $0 6 $95,308 2 $99,275 APPLICATIONS DENIED 1 $89,090 21 $76,795 155 $91,194 38 $40,001 0 $0 10 $57,285 7 $73,890 APPLICATIONS WITHDRAWN 1 $87,460 14 $134,970 60 $97,562 4 $42,590 0 $0 1 $48,360 1 $115,230 FILES CLOSED FOR INCOMPLETENESS 1 $114,020 22 $93,358 16 $117,541 0 $0 0 $0 1 $63,360 1 $114,020
Aggregated Statistics For Year 2006(Based on 3 full and 3 partial tracts) A) FHA, FSA/RHS & VA B) Conventional C) Refinancings D) Home Improvement Loans E) Loans on Dwellings For 5+ Families F) Non-occupant Loans on G) Loans On Manufactured Number Average Value Number Average Value Number Average Value Number Average Value Number Average Value Number Average Value Number Average Value
LOANS ORIGINATED 17 $111,835 189 $114,223 170 $100,335 31 $133,061 3 $159,173 44 $98,609 16 $78,939 APPLICATIONS APPROVED, NOT ACCEPTED 0 $0 18 $88,641 44 $83,558 4 $22,198 0 $0 5 $65,902 6 $48,213 APPLICATIONS DENIED 3 $125,523 52 $81,165 131 $92,179 22 $38,124 0 $0 10 $68,182 18 $61,152 APPLICATIONS WITHDRAWN 4 $89,172 30 $99,950 60 $112,861 4 $35,485 0 $0 3 $134,073 7 $76,397 FILES CLOSED FOR INCOMPLETENESS 0 $0 6 $121,120 21 $124,639 2 $48,985 0 $0 0 $0 0 $0
Aggregated Statistics For Year 2005(Based on 3 full and 3 partial tracts) A) FHA, FSA/RHS & VA B) Conventional C) Refinancings D) Home Improvement Loans E) Loans on Dwellings For 5+ Families F) Non-occupant Loans on G) Loans On Manufactured Number Average Value Number Average Value Number Average Value Number Average Value Number Average Value Number Average Value Number Average Value
LOANS ORIGINATED 18 $95,762 158 $114,955 175 $101,699 21 $32,708 2 $224,210 49 $120,412 12 $55,938 APPLICATIONS APPROVED, NOT ACCEPTED 1 $113,290 17 $74,286 32 $96,249 6 $38,977 0 $0 5 $66,012 6 $51,607 APPLICATIONS DENIED 4 $65,635 41 $70,712 154 $95,844 33 $45,895 0 $0 14 $64,636 31 $59,905 APPLICATIONS WITHDRAWN 1 $96,000 32 $109,997 58 $91,938 3 $131,150 0 $0 2 $69,720 2 $119,780 FILES CLOSED FOR INCOMPLETENESS 0 $0 2 $105,595 11 $124,550 1 $207,830 0 $0 1 $57,990 0 $0
Aggregated Statistics For Year 2004(Based on 3 full and 3 partial tracts) A) FHA, FSA/RHS & VA B) Conventional C) Refinancings D) Home Improvement Loans E) Loans on Dwellings For 5+ Families F) Non-occupant Loans on G) Loans On Manufactured Number Average Value Number Average Value Number Average Value Number Average Value Number Average Value Number Average Value Number Average Value
LOANS ORIGINATED 18 $98,212 134 $105,900 198 $107,126 17 $49,290 1 $449,190 50 $105,567 10 $50,368 APPLICATIONS APPROVED, NOT ACCEPTED 0 $0 25 $72,949 26 $88,227 5 $37,842 0 $0 3 $98,787 7 $49,386 APPLICATIONS DENIED 5 $73,056 46 $73,972 112 $93,349 17 $52,129 0 $0 17 $93,807 24 $50,838 APPLICATIONS WITHDRAWN 3 $111,410 27 $106,790 45 $98,302 5 $19,400 0 $0 7 $94,727 2 $64,140 FILES CLOSED FOR INCOMPLETENESS 0 $0 4 $80,818 8 $139,140 0 $0 0 $0 1 $61,120 0 $0
Aggregated Statistics For Year 2003(Based on 3 full and 3 partial tracts) A) FHA, FSA/RHS & VA B) Conventional C) Refinancings D) Home Improvement Loans F) Non-occupant Loans on Number Average Value Number Average Value Number Average Value Number Average Value Number Average Value
LOANS ORIGINATED 19 $94,635 128 $100,955 391 $104,953 19 $33,972 59 $90,707 APPLICATIONS APPROVED, NOT ACCEPTED 2 $88,450 30 $95,042 49 $97,559 2 $6,570 6 $50,890 APPLICATIONS DENIED 4 $99,752 49 $71,410 126 $90,966 11 $67,275 13 $64,611 APPLICATIONS WITHDRAWN 2 $90,000 20 $128,194 52 $101,432 1 $5,510 7 $57,107 FILES CLOSED FOR INCOMPLETENESS 1 $103,090 4 $68,945 12 $120,142 0 $0 0 $0
Aggregated Statistics For Year 2002(Based on 3 full and 1 partial tracts) A) FHA, FSA/RHS & VA B) Conventional C) Refinancings D) Home Improvement Loans E) Loans on Dwellings For 5+ Families F) Non-occupant Loans on Number Average Value Number Average Value Number Average Value Number Average Value Number Average Value Number Average Value
LOANS ORIGINATED 10 $93,274 116 $110,389 267 $102,829 8 $12,610 2 $1,379,670 51 $85,111 APPLICATIONS APPROVED, NOT ACCEPTED 1 $66,000 12 $115,599 30 $84,456 5 $3,950 0 $0 5 $44,218 APPLICATIONS DENIED 3 $64,303 28 $57,121 97 $75,759 9 $20,160 0 $0 5 $47,916 APPLICATIONS WITHDRAWN 0 $0 15 $91,789 45 $92,239 1 $24,570 0 $0 0 $0 FILES CLOSED FOR INCOMPLETENESS 0 $0 3 $93,337 19 $90,882 0 $0 0 $0 2 $175,000
Aggregated Statistics For Year 2001(Based on 3 full and 1 partial tracts) A) FHA, FSA/RHS & VA B) Conventional C) Refinancings D) Home Improvement Loans E) Loans on Dwellings For 5+ Families F) Non-occupant Loans on Number Average Value Number Average Value Number Average Value Number Average Value Number Average Value Number Average Value
LOANS ORIGINATED 9 $87,426 139 $100,173 252 $91,281 15 $18,455 2 $1,159,835 54 $72,764 APPLICATIONS APPROVED, NOT ACCEPTED 0 $0 23 $60,340 36 $66,036 5 $14,798 0 $0 5 $79,122 APPLICATIONS DENIED 0 $0 71 $53,758 81 $70,703 9 $23,376 0 $0 8 $75,072 APPLICATIONS WITHDRAWN 1 $54,280 13 $125,153 42 $69,496 1 $16,710 0 $0 2 $67,050 FILES CLOSED FOR INCOMPLETENESS 0 $0 5 $46,684 11 $88,174 0 $0 0 $0 1 $34,000
Aggregated Statistics For Year 2000(Based on 3 full and 1 partial tracts) A) FHA, FSA/RHS & VA B) Conventional C) Refinancings D) Home Improvement Loans F) Non-occupant Loans on Number Average Value Number Average Value Number Average Value Number Average Value Number Average Value
LOANS ORIGINATED 9 $94,944 137 $90,008 117 $76,224 29 $18,683 40 $73,238 APPLICATIONS APPROVED, NOT ACCEPTED 6 $30,662 64 $48,961 35 $54,908 9 $17,973 5 $43,540 APPLICATIONS DENIED 4 $50,180 237 $46,522 101 $59,333 18 $23,688 24 $40,604 APPLICATIONS WITHDRAWN 2 $64,245 17 $60,027 72 $72,136 5 $31,112 14 $56,816 FILES CLOSED FOR INCOMPLETENESS 1 $80,600 4 $50,068 10 $64,220 0 $0 2 $48,615
Aggregated Statistics For Year 1999(Based on 3 full and 1 partial tracts) A) FHA, FSA/RHS & VA B) Conventional C) Refinancings D) Home Improvement Loans E) Loans on Dwellings For 5+ Families F) Non-occupant Loans on Number Average Value Number Average Value Number Average Value Number Average Value Number Average Value Number Average Value
LOANS ORIGINATED 12 $83,973 183 $73,163 190 $76,105 28 $14,477 3 $89,967 37 $57,023 APPLICATIONS APPROVED, NOT ACCEPTED 0 $0 171 $49,280 77 $55,388 5 $10,836 0 $0 15 $41,351 APPLICATIONS DENIED 4 $73,892 447 $48,067 129 $55,972 15 $18,139 0 $0 24 $56,413 APPLICATIONS WITHDRAWN 0 $0 19 $74,703 58 $57,781 4 $16,832 0 $0 1 $83,000 FILES CLOSED FOR INCOMPLETENESS 0 $0 9 $89,114 19 $62,027 0 $0 0 $0 1 $49,230
Detailed HMDA statistics for the following Tracts:
0202.02
, 0204.00 , 0205.00 , 0206.00 , 0207.00 , 0208.02
Private Mortgage Insurance Companies Aggregated Statistics For Year 2009(Based on 2 full and 3 partial tracts) A) Conventional B) Refinancings Number Average Value Number Average Value
LOANS ORIGINATED 6 $185,972 8 $172,209 APPLICATIONS APPROVED, NOT ACCEPTED 3 $164,427 2 $229,855 APPLICATIONS DENIED 1 $159,000 0 $0 APPLICATIONS WITHDRAWN 0 $0 0 $0 FILES CLOSED FOR INCOMPLETENESS 0 $0 1 $82,560
Aggregated Statistics For Year 2008(Based on 3 full and 3 partial tracts) A) Conventional B) Refinancings C) Non-occupant Loans on Number Average Value Number Average Value Number Average Value
LOANS ORIGINATED 13 $140,921 5 $201,762 0 $0 APPLICATIONS APPROVED, NOT ACCEPTED 1 $103,580 2 $146,000 0 $0 APPLICATIONS DENIED 1 $185,810 0 $0 1 $185,810 APPLICATIONS WITHDRAWN 2 $196,000 0 $0 0 $0 FILES CLOSED FOR INCOMPLETENESS 1 $159,000 0 $0 1 $159,000
Aggregated Statistics For Year 2007(Based on 3 full and 3 partial tracts) A) Conventional B) Refinancings C) Non-occupant Loans on Number Average Value Number Average Value Number Average Value
LOANS ORIGINATED 28 $104,420 10 $146,314 3 $52,467 APPLICATIONS APPROVED, NOT ACCEPTED 3 $77,590 2 $115,730 0 $0 APPLICATIONS DENIED 0 $0 0 $0 0 $0 APPLICATIONS WITHDRAWN 2 $176,630 0 $0 0 $0 FILES CLOSED FOR INCOMPLETENESS 1 $92,040 0 $0 0 $0
Aggregated Statistics For Year 2006(Based on 3 full and 3 partial tracts) A) Conventional B) Refinancings C) Non-occupant Loans on Number Average Value Number Average Value Number Average Value
LOANS ORIGINATED 18 $112,264 4 $157,908 4 $84,890 APPLICATIONS APPROVED, NOT ACCEPTED 2 $63,860 0 $0 1 $53,080 APPLICATIONS DENIED 0 $0 0 $0 0 $0 APPLICATIONS WITHDRAWN 2 $131,770 0 $0 0 $0 FILES CLOSED FOR INCOMPLETENESS 0 $0 0 $0 0 $0
Aggregated Statistics For Year 2005(Based on 2 full and 3 partial tracts) A) Conventional B) Refinancings C) Non-occupant Loans on Number Average Value Number Average Value Number Average Value
LOANS ORIGINATED 13 $117,879 9 $106,677 0 $0 APPLICATIONS APPROVED, NOT ACCEPTED 4 $69,240 2 $155,095 1 $142,350 APPLICATIONS DENIED 0 $0 0 $0 0 $0 APPLICATIONS WITHDRAWN 0 $0 1 $156,280 0 $0 FILES CLOSED FOR INCOMPLETENESS 0 $0 0 $0 0 $0
Aggregated Statistics For Year 2004(Based on 2 full and 3 partial tracts) A) Conventional B) Refinancings C) Non-occupant Loans on Number Average Value Number Average Value Number Average Value
LOANS ORIGINATED 12 $120,600 12 $116,159 3 $65,323 APPLICATIONS APPROVED, NOT ACCEPTED 0 $0 4 $112,870 0 $0 APPLICATIONS DENIED 0 $0 1 $127,780 0 $0 APPLICATIONS WITHDRAWN 0 $0 0 $0 0 $0 FILES CLOSED FOR INCOMPLETENESS 0 $0 0 $0 0 $0
Aggregated Statistics For Year 2003(Based on 3 full and 3 partial tracts) A) Conventional B) Refinancings C) Non-occupant Loans on Number Average Value Number Average Value Number Average Value
LOANS ORIGINATED 20 $108,856 30 $123,642 1 $92,600 APPLICATIONS APPROVED, NOT ACCEPTED 4 $93,158 5 $88,452 2 $86,770 APPLICATIONS DENIED 1 $92,070 1 $97,630 1 $56,730 APPLICATIONS WITHDRAWN 2 $110,065 1 $86,190 0 $0 FILES CLOSED FOR INCOMPLETENESS 0 $0 0 $0 0 $0
Aggregated Statistics For Year 2002(Based on 3 full and 1 partial tracts) A) Conventional B) Refinancings C) Non-occupant Loans on Number Average Value Number Average Value Number Average Value
LOANS ORIGINATED 26 $110,837 21 $135,236 3 $77,000 APPLICATIONS APPROVED, NOT ACCEPTED 2 $53,700 5 $132,934 1 $35,400 APPLICATIONS DENIED 1 $88,900 0 $0 0 $0 APPLICATIONS WITHDRAWN 1 $69,000 0 $0 1 $69,000 FILES CLOSED FOR INCOMPLETENESS 0 $0 2 $100,875 0 $0
Aggregated Statistics For Year 2001(Based on 3 full and 1 partial tracts) A) Conventional B) Refinancings C) Non-occupant Loans on Number Average Value Number Average Value Number Average Value
LOANS ORIGINATED 26 $116,251 20 $98,184 6 $72,757 APPLICATIONS APPROVED, NOT ACCEPTED 2 $124,085 3 $96,437 0 $0 APPLICATIONS DENIED 0 $0 4 $84,292 0 $0 APPLICATIONS WITHDRAWN 0 $0 0 $0 0 $0 FILES CLOSED FOR INCOMPLETENESS 0 $0 0 $0 0 $0
Aggregated Statistics For Year 2000(Based on 2 full and 1 partial tracts) A) Conventional B) Refinancings C) Non-occupant Loans on Number Average Value Number Average Value Number Average Value
LOANS ORIGINATED 13 $100,181 6 $69,565 3 $39,133 APPLICATIONS APPROVED, NOT ACCEPTED 1 $84,960 0 $0 0 $0 APPLICATIONS DENIED 0 $0 0 $0 0 $0 APPLICATIONS WITHDRAWN 3 $242,910 0 $0 0 $0 FILES CLOSED FOR INCOMPLETENESS 0 $0 0 $0 0 $0
Aggregated Statistics For Year 1999(Based on 3 full and 1 partial tracts) A) Conventional B) Refinancings C) Non-occupant Loans on Number Average Value Number Average Value Number Average Value
LOANS ORIGINATED 21 $104,215 13 $93,372 2 $80,810 APPLICATIONS APPROVED, NOT ACCEPTED 0 $0 1 $56,130 0 $0 APPLICATIONS DENIED 0 $0 0 $0 0 $0 APPLICATIONS WITHDRAWN 0 $0 0 $0 0 $0 FILES CLOSED FOR INCOMPLETENESS 0 $0 0 $0 0 $0
Detailed PMIC statistics for the following Tracts:
0202.02
, 0204.00 , 0205.00 , 0206.00 , 0207.00 , 0208.02 Fire-safe hotels and motels in Morganton, North Carolina:
Sleep Inn Morganton, 2400a S Sterling St, Morganton, North Carolina 28655 Phone: (828) 433-9000, Fax: (828) 438-3674
Days Inn Morganton, 2402 S Sterling St, Morganton, North Carolina 28655 Phone: (828) 433-0011, Fax: (828) 437-0985
Hampton Inn Morganton, 115 Bush Dr, Morganton, North Carolina 28655 Phone: (828) 432-2000, Fax: (828) 433-9920
Holiday Inn Morganton, 2400 S Sterling St, Morganton, North Carolina 28655 Phone: (828) 437-0171, Fax: (828) 437-1639
All 4 fire-safe hotels and motels in Morganton, North Carolina
Most common first names in Morganton, NC among deceased individuals Name Count Lived (average)
James 400 71.4 years Mary 355 79.3 years William 338 73.3 years John 333 74.4 years Robert 250 72.0 years Charles 195 71.3 years Annie 150 79.3 years Ruth 119 77.7 years George 111 74.8 years Thomas 105 70.9 years
Most common last names in Morganton, NC among deceased individuals Last name Count Lived (average)
Smith 297 73.9 years Williams 170 76.9 years Carswell 142 73.9 years Clark 124 72.3 years Johnson 110 70.8 years Walker 106 77.9 years Mull 105 78.9 years Davis 93 71.5 years Dale 91 77.2 years Powell 90 72.9 years
Morganton compared to North Carolina state average:
Unemployed percentage significantly below state average. Hispanic race population percentage above state average. Median age below state average. Length of stay since moving in significantly below state average. House age above state average. Institutionalized population percentage above state average.
#24 on the list of "Top 101 cities with the largest percentage of people in mental (psychiatric) hospitals or wards (population 1,000+)"
#32 on the list of "Top 101 cities with the largest percentage of people in schools, hospitals, or wards for the mentally retarded (population 1,000+)"
#44 on the list of "Top 101 cities with the most residents born in Guatemala (population 500+)"
#60 on the list of "Top 101 cities with the largest percentage of people in hospitals or wards for drug/alcohol abuse (population 1,000+)"
#63 on the list of "Top 101 cities with largest percentage of males in industries: other services, except public administration (population 5,000+)"
#24 on the list of "Top 101 counties with the largest increase in the number of deaths per 1000 residents 2000-2006 to 2007-2013 (pop. 50,000+)"
#69 on the list of "Top 101 counties with the lowest ground withdrawal of fresh water for public supply (pop. 50,000+)"
#95 on the list of "Top 101 counties with the smallest number of people without health insurance coverage in 2000 (pop. 50,000+)"
Top Patent Applicants
Keith Aaron Greer (7)
Michael D. Williams (6)
R. David Alderson (5)
Ethan Franklin (5)
Peter James Lohr, Sr. (4)
Charles Douglas Mccurry (4)
Gregory B. Norell (4)
Keith A. Greer (3)
Ethan E. Franklin (2)
James Carl Toner (2)
Total of 52 patent applications in 2008-2024.


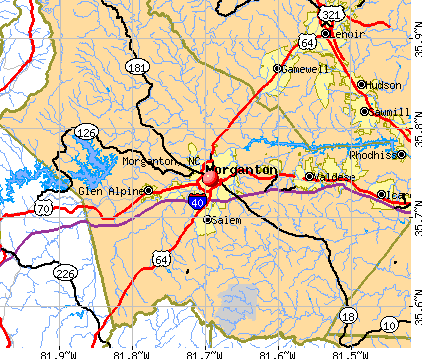


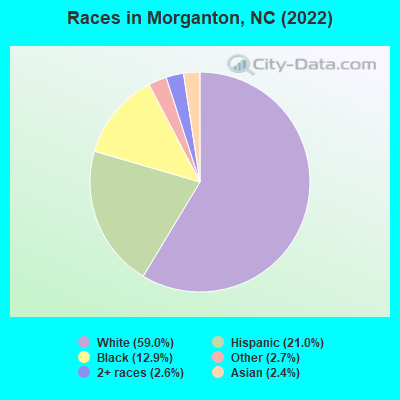
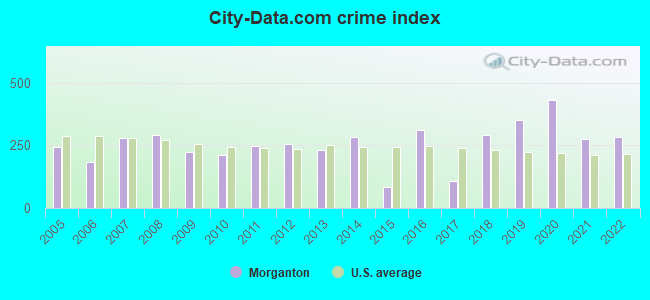
 Recent articles from our blog. Our writers, many of them Ph.D. graduates or candidates, create easy-to-read articles on a wide variety of topics.

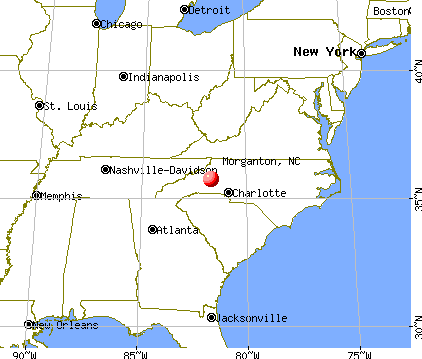
 (44.4 miles
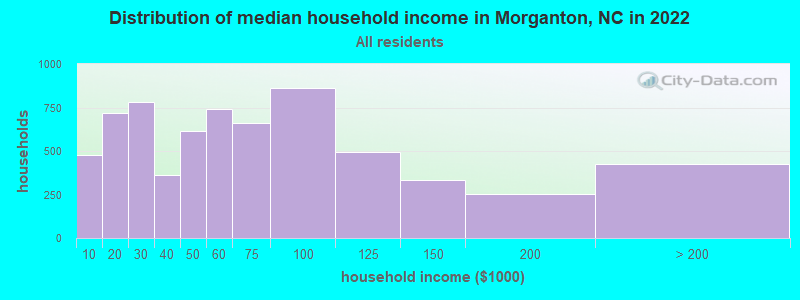
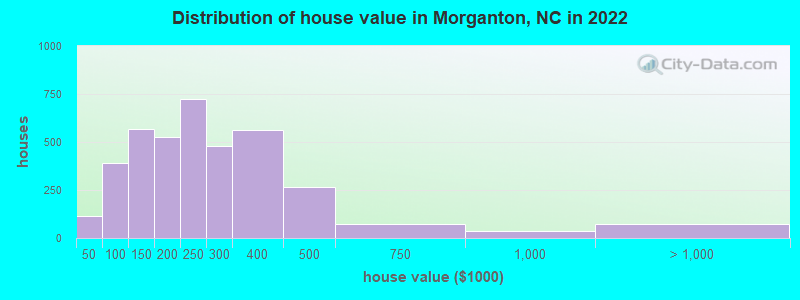

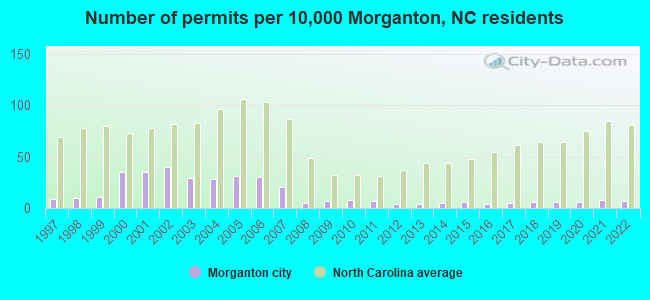
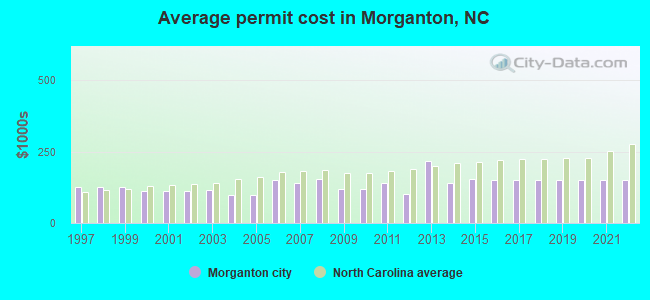
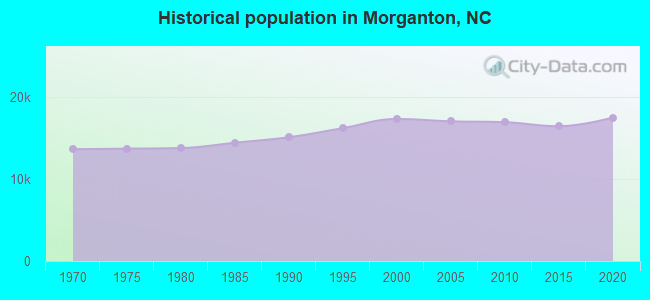
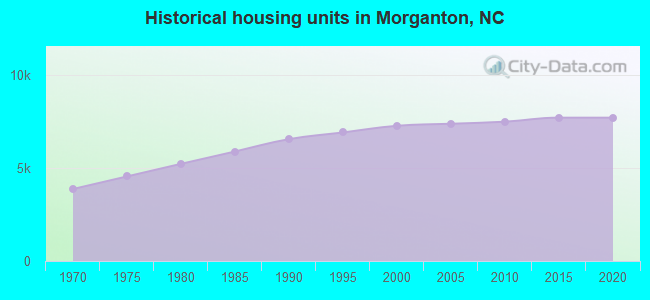
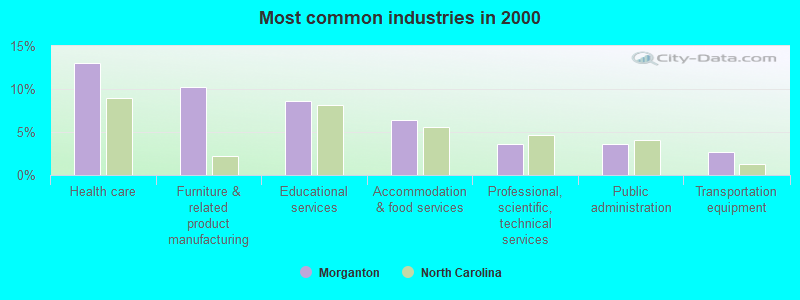
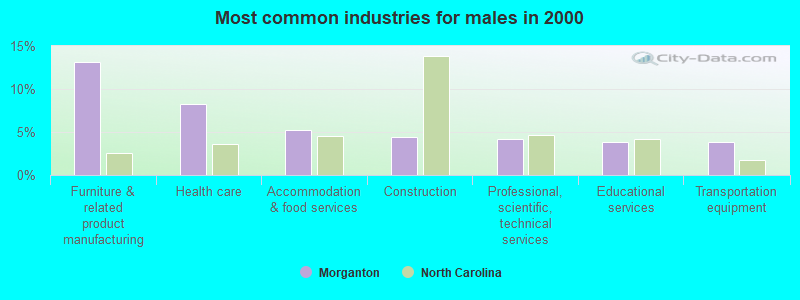
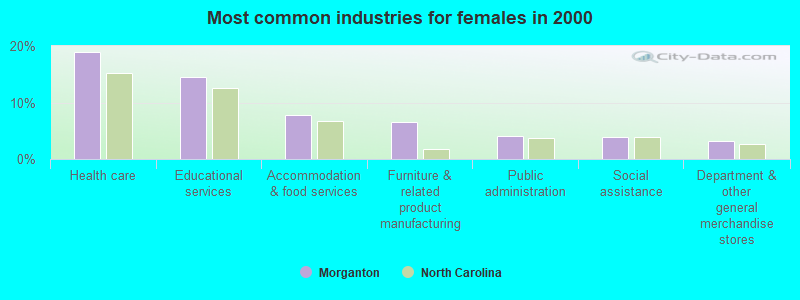
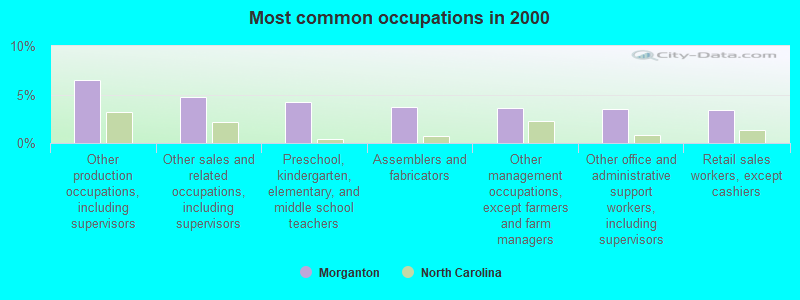
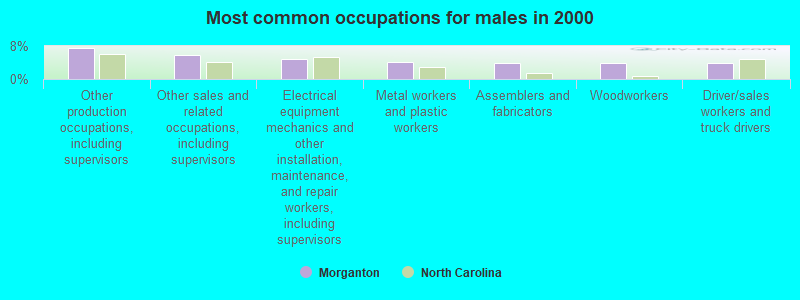
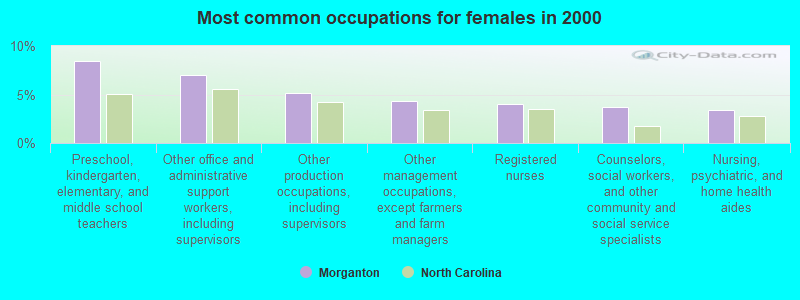

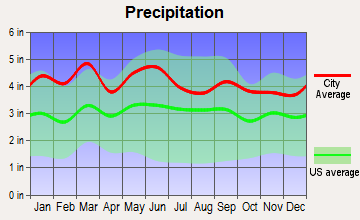


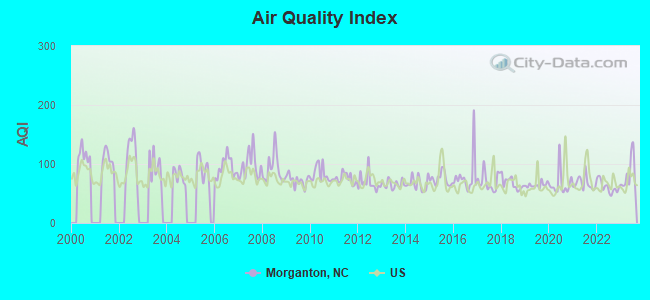
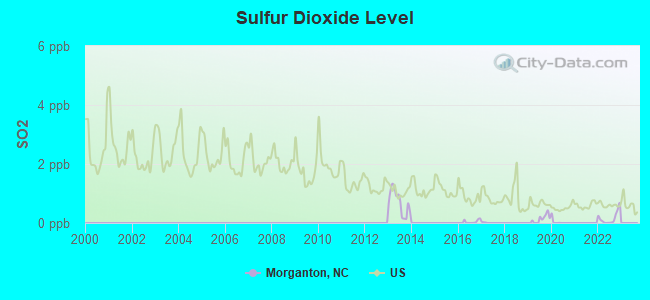
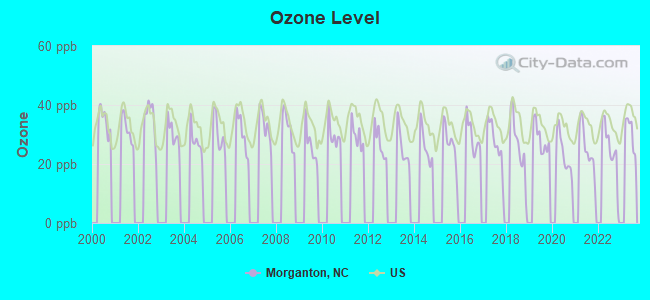
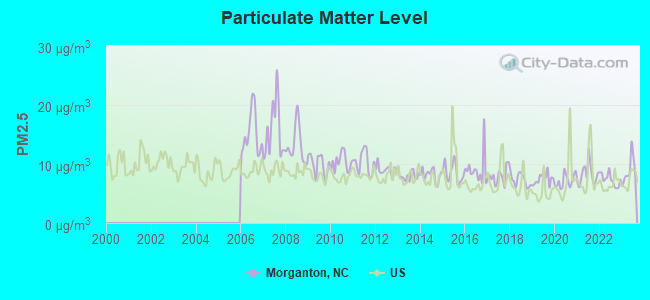

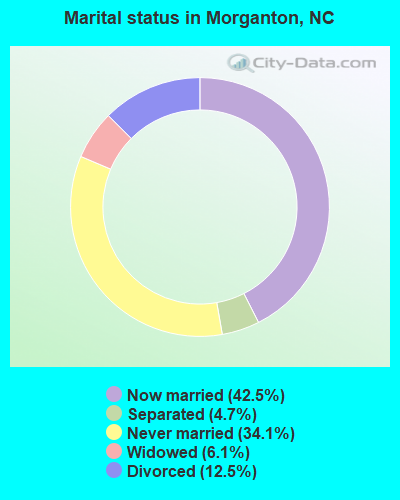
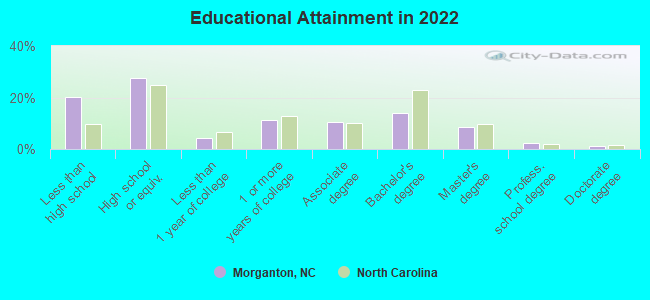
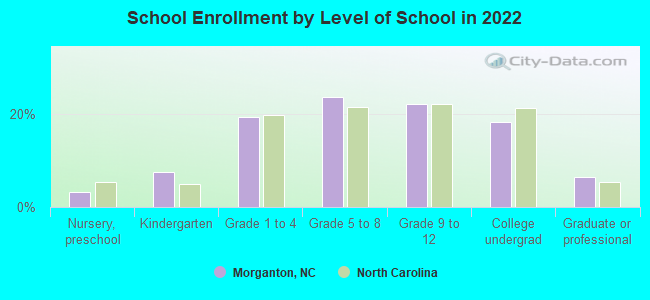
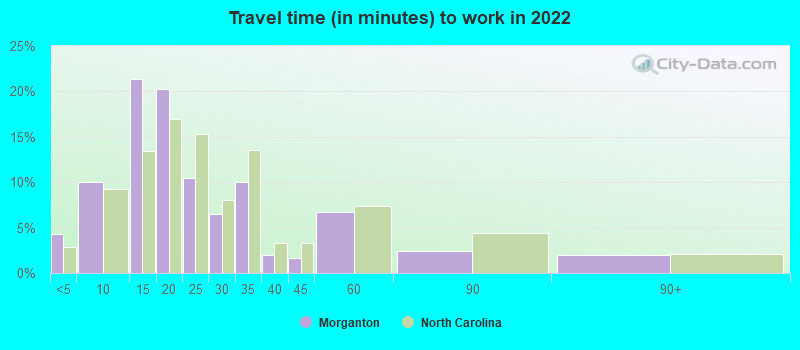
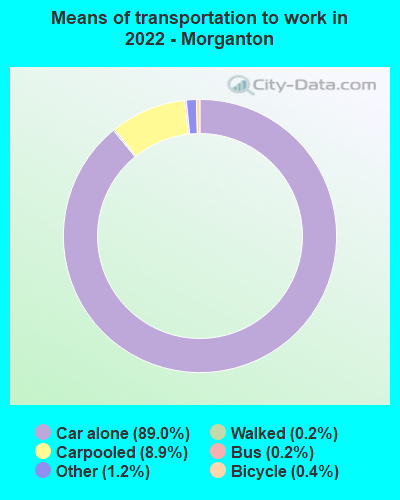
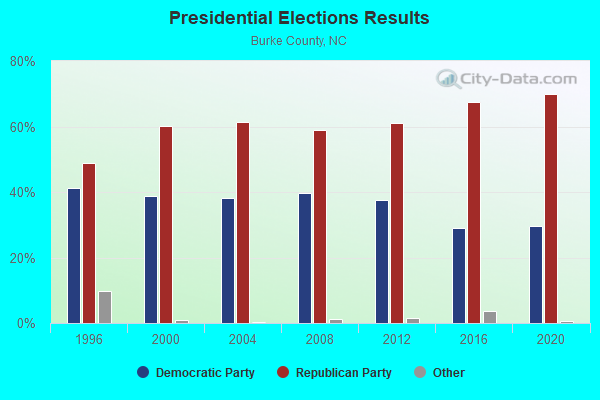
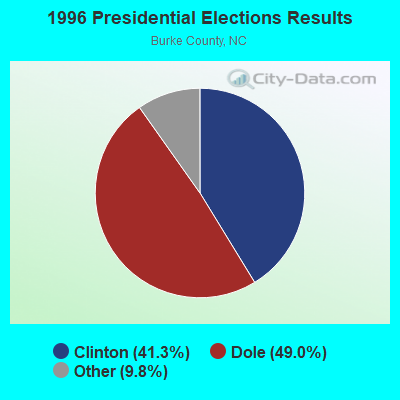
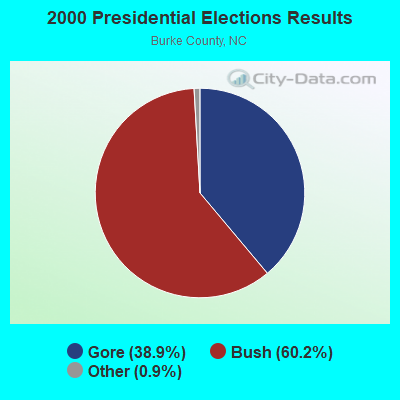

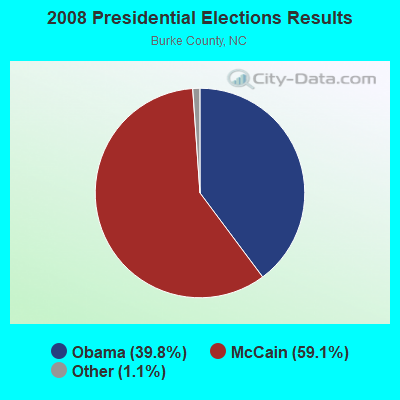
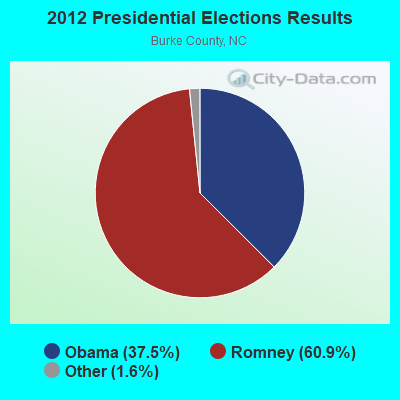
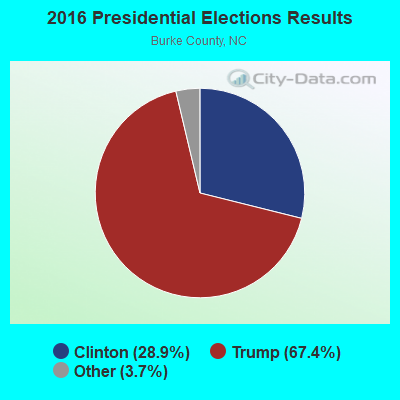
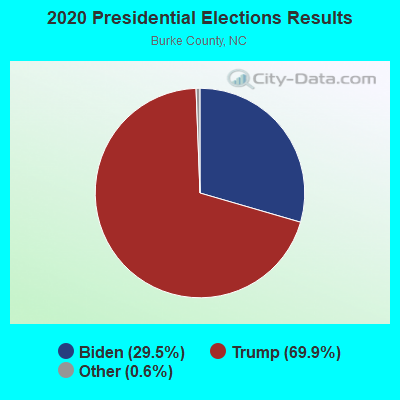
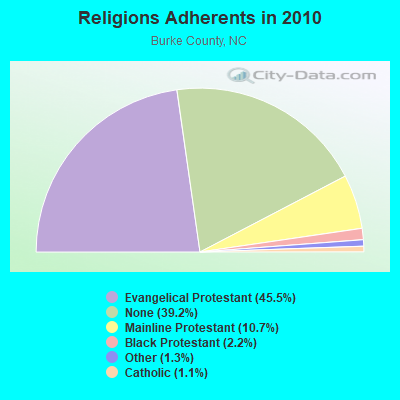
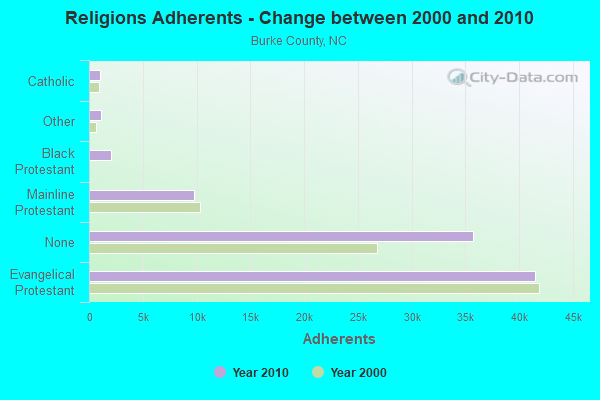
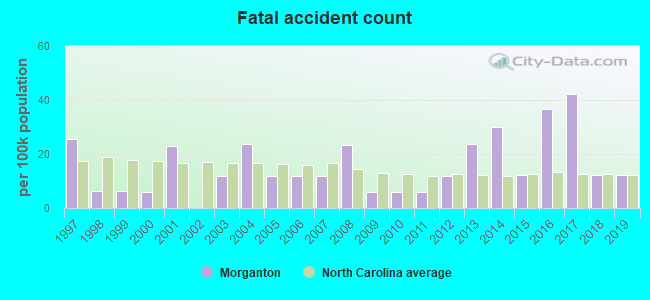
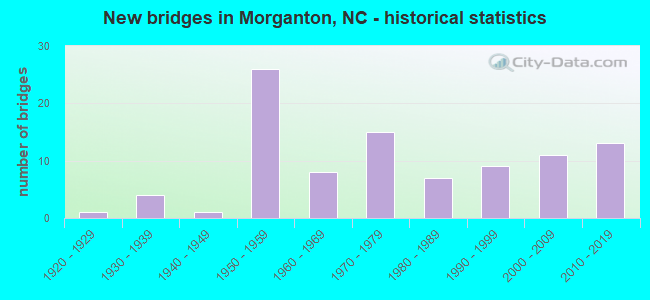
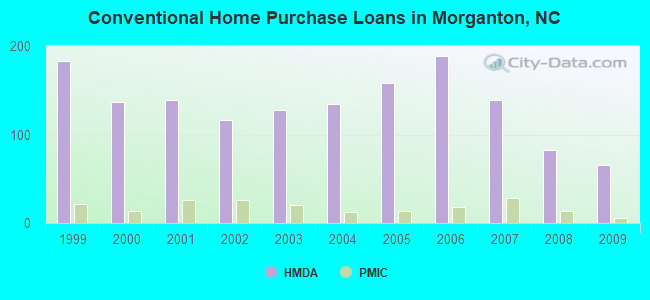
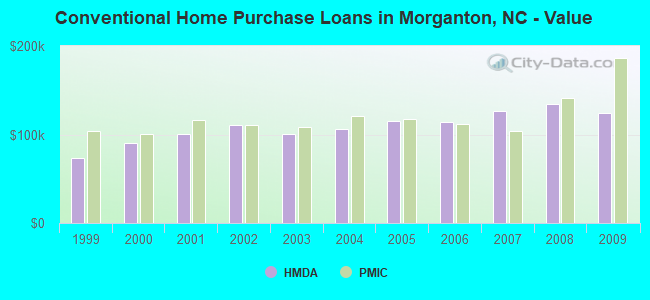
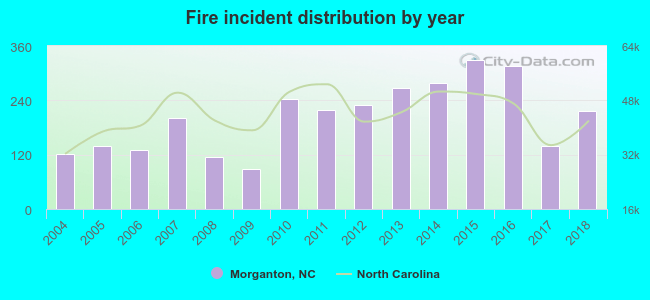 According to the data from the years 2004 - 2018 the average number of fires per year is 202. The highest number of reported fire incidents - 329 took place in 2015, and the least - 89 in 2009. The data has a growing trend.
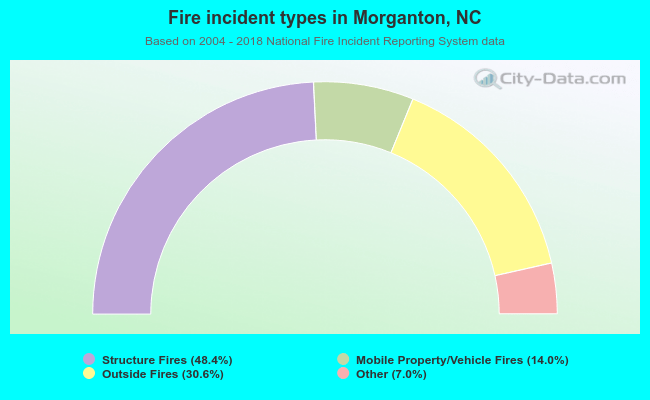 When looking into fire subcategories, the most incidents belonged to: Structure Fires (48.4%), and Outside Fires (30.6%).