Morganton: Fire Incidents, North Carolina (NC)
Where are fire incidents reported in Morganton, NC
Something went wrong! Please refresh the page.
| Fire incidents reported | |
|---|---|
| Sreet name | Count |
| BURKEMONT AVE | 152 |
| JAMESTOWN RD | 118 |
| UNION ST | 110 |
| STERLING ST | 98 |
| FLEMING DR | 92 |
| GREEN ST | 80 |
| CARBON CITY RD | 76 |
| BETHEL RD | 72 |
| ENOLA RD | 58 |
| US 64 HWY | 56 |
| HOPEWELL RD | 48 |
| OLD NC 18 HWY | 46 |
| MORGANTON HEIGHTS BLVD | 42 |
| CONLEY RD | 40 |
| AMHERST RD | 36 |
| NC 18 HWY | 36 |
| MEETING ST | 34 |
| LENOIR RD | 32 |
| NC 126 HWY | 32 |
| OLD NC 18 | 32 |
| REEP DR | 32 |
| BURKEMONT RD | 30 |
| I 40 HWY | 30 |
| MOUNT OLIVE CHURCH RD | 30 |
| PARKER RD | 30 |
| PINEY RD | 30 |
| RIVER RD | 30 |
| KATHY RD | 28 |
| ZERO MULL RD | 28 |
| DYSARTSVILLE RD | 26 |
| Other | 1,460 |
2004 - 2018 National Fire Incident Reporting System (NFIRS) incidents
- Incident types reported to NFIRS in Morganton, NC
- 7,31647.7%Rescue & EMS
- 3,04419.9%Fire
- 1,75211.4%Hazardous Condition
- 1,4099.2%False Alarm
- 8635.6%Good Intent Call
- 8165.3%Service Call
- 580.4%Special Incident
- 450.3%Severe Weather
- 280.2%Overpressure Rupture
- Fire incident types reported to NFIRS in Morganton, NC
- 1,47448.4%Structure Fires
- 93130.6%Outside Fires
- 42514.0%Mobile Property/Vehicle Fires
- 2147.0%Other
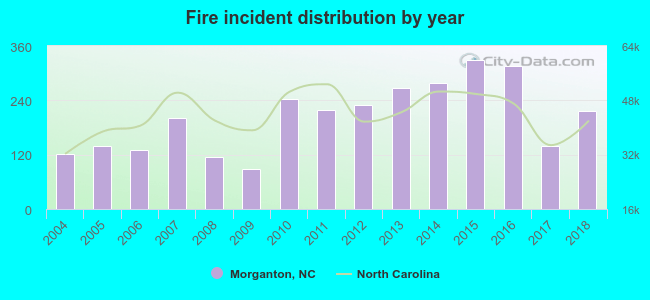 Based on the data from the years 2004 - 2018 the average number of fires per year is 202. The highest number of reported fire incidents - 329 took place in 2015, and the least - 89 in 2009. The data has a growing trend.
The average number of yearly fire incidents per 10k residents in Morganton, NC compared to nearest cities:
(Note: Based on data for the last 3 years, including only cities with population 5,000 and above)
| Morganton: | 134.4 |
| Lenoir: | 95.8 |
| Marion: | 300.1 |
| Hickory: | 72.1 |
| Conover: | 47.5 |
| Newton: | 24.1 |
| Forest City: | 99.2 |
| Cherryville: | 89.2 |
| Lincolnton: | 216.8 |
 The median response time based on all reported fire incidents is 7 minutes. This is comparable to the state median value.
The median response time in Morganton, NC compared to nearest cities:
(Note: Based on data for all years, including only cities with at least 500 fire incidents)
| Morganton: | 7 minutes |
| Valdese: | 6 minutes |
| Connelly Springs: | 8 minutes |
| Hudson: | 4 minutes |
| Lenoir: | 4 minutes |
| Granite Falls: | 4 minutes |
| Laurel Hill: | 7 minutes |
| Marion: | 9 minutes |
| Hickory: | 5 minutes |
 According to the reports from the years 2004 - 2018 the average number of fire-related fatalities per year is 1. The highest number of deaths - 5 took place in 2013, and the lowest - 0 in 2004. The data has a constant trend.
The average number of fatalities per 1,000 fire incidents is 3. This indicator was the highest - 19 in 2013, and the lowest 0 in 2004. The trend for fatalities per 1,000 fires is constant. Compared to the North Carolina value the number of fatalities per 1,000 incidents is much higher.
According to the reports from the years 2004 - 2018 the average number of fire-related fatalities per year is 1. The highest number of deaths - 5 took place in 2013, and the lowest - 0 in 2004. The data has a constant trend.
The average number of fatalities per 1,000 fire incidents is 3. This indicator was the highest - 19 in 2013, and the lowest 0 in 2004. The trend for fatalities per 1,000 fires is constant. Compared to the North Carolina value the number of fatalities per 1,000 incidents is much higher.Deaths per 1,000 incidents in Morganton, NC compared to nearest cities:
(Note: Based on data for all years, including only cities with at least 2,500 fire incidents)
| Morganton: | 3.0 |
| Lenoir: | 1.3 |
| Marion: | 1.4 |
| Hickory: | 0.8 |
| Lincolnton: | 2.4 |
| Shelby: | 1.1 |
 According to the data from the years 2004 - 2018 the average number of fire-related casualties per year is 1. The highest number of reported casualties - 7 took place in 2006, and the lowest - 0 in 2009. The data has a dropping trend.
The average number of injuries per 1,000 fires is 9. This indicator was the highest - 54 in 2006, and the lowest 0 in 2009. The trend for injuries per 1,000 fire incidents is decreasing. Compared to the North Carolina value the number of casualties per 1,000 incidents is about the same.
According to the data from the years 2004 - 2018 the average number of fire-related casualties per year is 1. The highest number of reported casualties - 7 took place in 2006, and the lowest - 0 in 2009. The data has a dropping trend.
The average number of injuries per 1,000 fires is 9. This indicator was the highest - 54 in 2006, and the lowest 0 in 2009. The trend for injuries per 1,000 fire incidents is decreasing. Compared to the North Carolina value the number of casualties per 1,000 incidents is about the same.Casualties per 1,000 incidents in Morganton, NC compared to nearest cities:
(Note: Based on data for all years, including only cities with at least 500 fire incidents)
| Morganton: | 6.9 |
| Valdese: | 11.2 |
| Connelly Springs: | 4.8 |
| Hudson: | 3.5 |
| Lenoir: | 10.2 |
| Granite Falls: | 2.1 |
| Laurel Hill: | 0.0 |
| Marion: | 3.9 |
| Hickory: | 9.7 |
 30.9% incidents where reported in the morning and 69.1% in the evening. The most fires (16.0%) took place on Monday, and the least (12.9%) on Tuesday.
 According to the 3,044 fires from years 2004 - 2018 most fires (12.1%) took place during March, and the least (6.0%) in September.
 Out of all 15,331 cases reported during the years 2004 - 2018, the most belonged to the categories: Rescue & EMS (47.7%), Fire (19.9%), and Hazardous Condition (11.4%).
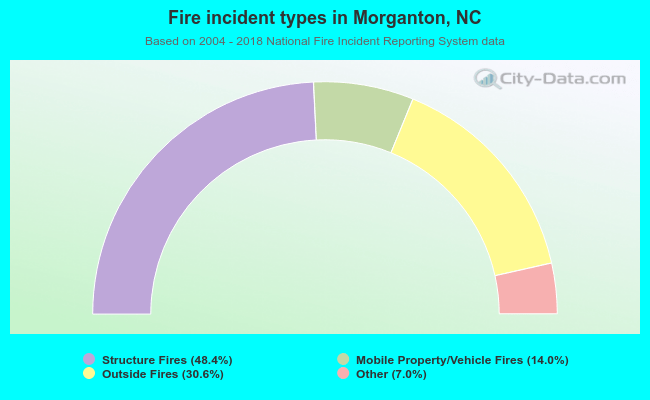 When looking into fire subcategories, the most incidents belonged to: Structure Fires (48.4%), and Outside Fires (30.6%).