Shelby: Fire Incidents, North Carolina (NC)
Where are fire incidents reported in Shelby, NC
Something went wrong! Please refresh the page.
| Fire incidents reported | |
|---|---|
| Sreet name | Count |
| DIXON BLVD | 220 |
| POST RD | 194 |
| LAFAYETTE ST | 144 |
| COLLEGE AVE | 134 |
| WASHBURN SWITCH RD | 78 |
| POLKVILLE RD | 76 |
| FALLSTON RD | 68 |
| MAIN ST | 62 |
| DAVIS RD | 58 |
| ZION CHURCH RD | 58 |
| OLD BOILING SPRINGS RD | 54 |
| STONEY POINT RD | 54 |
| MARION ST | 50 |
| DOUBLE SHOALS RD | 46 |
| AIRPORT RD | 38 |
| NEW PROSPECT CHURCH RD | 38 |
| STONY POINT RD | 38 |
| WEST DIXON BLVD | 38 |
| GROVER ST | 36 |
| ELIZABETH AVE | 34 |
| ELLIS RD | 34 |
| BURKE RD | 32 |
| CHRISTOPHER RD | 30 |
| POPLAR SPRINGS CH RD | 30 |
| CHERRYVILLE RD | 28 |
| W. DIXON BLVD | 28 |
| DEKALB ST | 26 |
| EARL RD | 26 |
| FRIENDSHIP RD | 26 |
| KINGS RD | 26 |
| Other | 1,690 |
2002 - 2018 National Fire Incident Reporting System (NFIRS) incidents
- Incident types reported to NFIRS in Shelby, NC
- 3,60825.2%Hazardous Condition
- 3,49424.4%Fire
- 3,20522.4%Rescue & EMS
- 1,82812.8%Good Intent Call
- 1,42810.0%False Alarm
- 5563.9%Service Call
- 1110.8%Severe Weather
- 330.2%Overpressure Rupture
- 290.2%Special Incident
- Fire incident types reported to NFIRS in Shelby, NC
- 1,67848.0%Structure Fires
- 1,18834.0%Outside Fires
- 36610.5%Mobile Property/Vehicle Fires
- 2627.5%Other
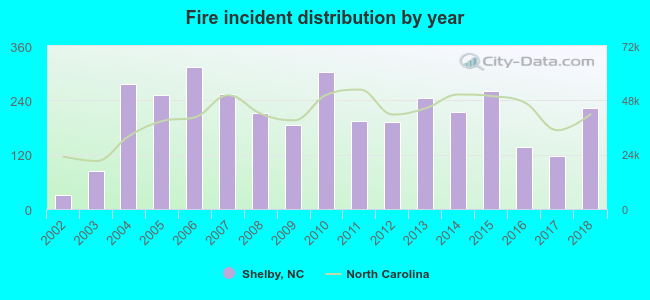 Based on the data from the years 2002 - 2018 the average number of fires per year is 206. The highest number of reported fire incidents - 313 took place in 2006, and the least - 32 in 2002. The data has a rising trend.
The average number of yearly fire incidents per 10k residents in Shelby, NC compared to nearest cities:
(Note: Based on data for the last 3 years, including only cities with population 5,000 and above)
| Shelby: | 78.1 |
| Cherryville: | 89.2 |
| Kings Mountain: | 112.4 |
| Bessemer City: | 46.8 |
| Forest City: | 99.2 |
| Gastonia: | 18.4 |
| Lincolnton: | 216.8 |
| Belmont: | 50.1 |
| Mount Holly: | 58.7 |
 The median response time based on all reported fire incidents is 8 minutes. This is higher compared to the state median value.
The median response time in Shelby, NC compared to nearest cities:
(Note: Based on data for all years, including only cities with at least 500 fire incidents)
| Shelby: | 8 minutes |
| Lawndale: | 8 minutes |
| Mooresboro: | 9 minutes |
| Grover: | 7 minutes |
| Cherryville: | 7 minutes |
| Kings Mountain: | 7 minutes |
| Ellenboro: | 8 minutes |
| Bostic: | 10 minutes |
| Laurel Hill: | 7 minutes |
 Based on the data from the years 2002 - 2018 the average number of fire-related fatalities per year is 0. The highest number of reported deaths - 2 took place in 2012, and the lowest - 0 in 2002. The data has a constant trend.
The average number of deaths per 1,000 fire incidents is 1. This indicator was the highest - 10 in 2012, and the lowest 0 in 2002. The trend for fatalities per 1,000 fire incidents is constant. Compared to the state value the number of fatalities per 1,000 fires is lower.
Based on the data from the years 2002 - 2018 the average number of fire-related fatalities per year is 0. The highest number of reported deaths - 2 took place in 2012, and the lowest - 0 in 2002. The data has a constant trend.
The average number of deaths per 1,000 fire incidents is 1. This indicator was the highest - 10 in 2012, and the lowest 0 in 2002. The trend for fatalities per 1,000 fire incidents is constant. Compared to the state value the number of fatalities per 1,000 fires is lower.Deaths per 1,000 incidents in Shelby, NC compared to nearest cities:
(Note: Based on data for all years, including only cities with at least 2,500 fire incidents)
| Shelby: | 1.1 |
| Gastonia: | 3.0 |
| Lincolnton: | 2.4 |
| Morganton: | 3.0 |
 30.1% incidents where reported in the morning and 69.9% in the evening. The most fires (15.1%) took place on Thursday, and the least (12.8%) on Wednesday.
 According to the 3,494 fire incidents from years 2002 - 2018 most fires (11.2%) took place during February, and the least (5.8%) in September.
 Out of all 14,292 cases reported during the years 2002 - 2018, the most belonged to the categories: Hazardous Condition (25.2%), Fire (24.4%), and Rescue & EMS (22.4%).
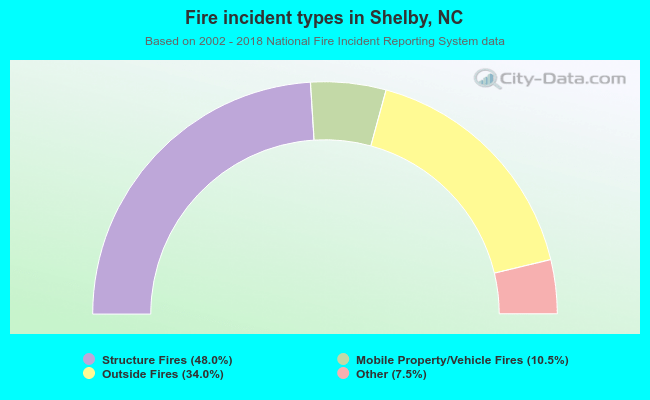 When looking into fire subcategories, the most reports belonged to: Structure Fires (48.0%), and Outside Fires (34.0%).