Walnut Park: Fire Incidents, California (CA)
Where are fire incidents reported in Walnut Park, CA
Something went wrong! Please refresh the page.
|
| |||||||||||||||||||||||||||||||||||||||||||||||||||||||||||||
2005 - 2018 National Fire Incident Reporting System (NFIRS) incidents
- Incident types reported to NFIRS in Walnut Park, CA
- 2,28269.2%Rescue & EMS
- 58317.7%Good Intent Call
- 1534.6%Fire
- 1434.3%False Alarm
- 742.2%Hazardous Condition
- 591.8%Service Call
- Fire incident types reported to NFIRS in Walnut Park, CA
- 6139.9%Structure Fires
- 5032.7%Outside Fires
- 2717.6%Mobile Property/Vehicle Fires
- 159.8%Other
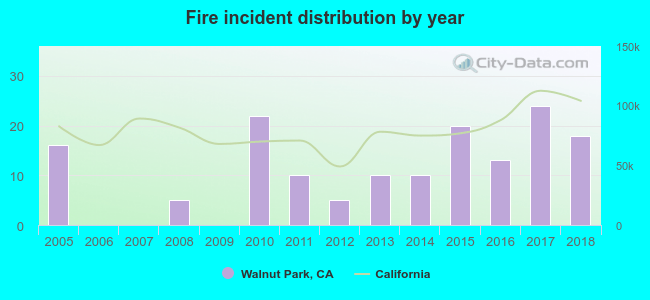 Based on the data from the years 2005 - 2018 the average number of fire incidents per year is 11. The highest number of reported fires - 24 took place in 2017, and the least - 0 in 2006. The data has a rising trend.
The average number of yearly fire incidents per 10k residents in Walnut Park, CA compared to nearest cities:
(Note: Based on data for the last 3 years, including only cities with population 5,000 and above)
| Walnut Park: | 11.5 |
| Huntington Park: | 19.9 |
| South Gate: | 15.8 |
| Cudahy: | 13.6 |
| Bell: | 19.0 |
| Maywood: | 12.2 |
| Lynwood: | 19.4 |
| Bell Gardens: | 18.3 |
| Commerce: | 70.9 |

 37.3% incidents where reported in the morning and 62.7% in the evening. The most fires (19.0%) took place on Wednesday, and the least (9.8%) on Saturday.
 According to the 153 fires from years 2005 - 2018 most fires (16.3%) took place during January, and the least (2.6%) in August.
 Out of all 3,297 cases reported during the years 2005 - 2018, the most belonged to the categories: Rescue & EMS (69.2%), Good Intent Call (17.7%), and Fire (4.6%).
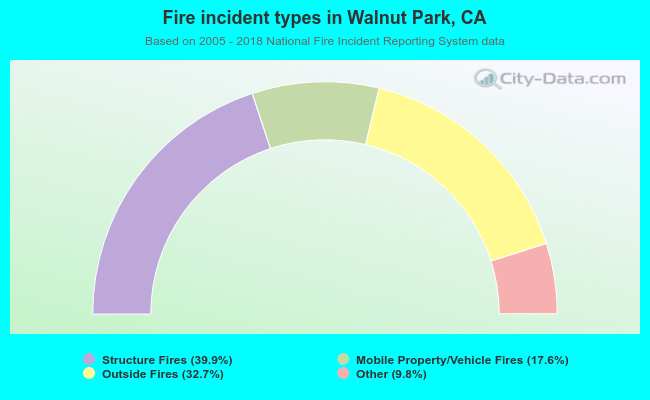 When looking into fire subcategories, the most incidents belonged to: Structure Fires (39.9%), and Outside Fires (32.7%).