South Gate: Fire Incidents, California (CA)
Where are fire incidents reported in South Gate, CA
Something went wrong! Please refresh the page.
| Fire incidents reported | |
|---|---|
| Sreet name | Count |
| FIRESTONE | 272 |
| TWEEDY | 184 |
| GARFIELD | 164 |
| SOUTHERN | 110 |
| CALIFORNIA | 94 |
| ATLANTIC | 82 |
| LONG BEACH | 72 |
| INDEPENDENCE | 58 |
| VIRGINIA | 56 |
| SAN ANTONIO | 54 |
| SAN CARLOS | 52 |
| OTIS | 48 |
| SAN LUIS | 42 |
| SB 710 NO FIRESTONE | 42 |
| ARDMORE | 40 |
| PINEHURST | 40 |
| SANTA ANA | 40 |
| STATE | 40 |
| IMPERIAL | 38 |
| MADISON | 38 |
| ALAMEDA | 36 |
| LIBERTY | 36 |
| SAN GABRIEL | 36 |
| ALEXANDER | 34 |
| SAN MIGUEL | 34 |
| ELIZABETH | 32 |
| MCNERNEY | 32 |
| MISSOURI | 30 |
| SAN JUAN | 30 |
| SANTA FE | 30 |
2005 - 2018 National Fire Incident Reporting System (NFIRS) incidents
- Incident types reported to NFIRS in South Gate, CA
- 16,12961.9%Rescue & EMS
- 5,80522.3%Good Intent Call
- 1,6486.3%Fire
- 1,4245.5%False Alarm
- 5492.1%Hazardous Condition
- 4291.6%Service Call
- 320.1%Special Incident
- Fire incident types reported to NFIRS in South Gate, CA
- 71743.5%Outside Fires
- 43126.2%Structure Fires
- 35321.4%Mobile Property/Vehicle Fires
- 1478.9%Other
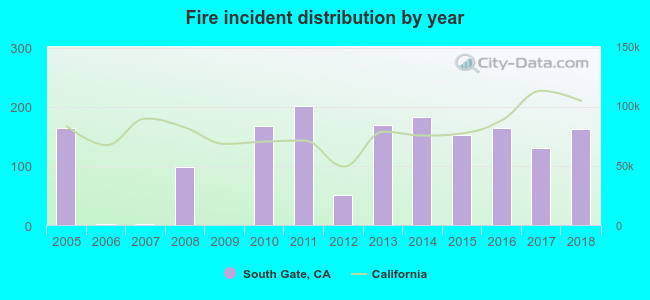 Based on the data from the years 2005 - 2018 the average number of fires per year is 118. The highest number of fires - 202 took place in 2011, and the least - 0 in 2009. The data has a decreasing trend.
The average number of yearly fire incidents per 10k residents in South Gate, CA compared to nearest cities:
(Note: Based on data for the last 3 years, including only cities with population 5,000 and above)
| South Gate: | 15.8 |
| Lynwood: | 19.4 |
| Cudahy: | 13.6 |
| Walnut Park: | 11.5 |
| Bell: | 19.0 |
| Bell Gardens: | 18.3 |
| Huntington Park: | 19.9 |
| Maywood: | 12.2 |
| Paramount: | 19.3 |
 The median response time based on all reported fire incidents is 5 minutes. This is lower compared to the state median value.
The median response time in South Gate, CA compared to nearest cities:
(Note: Based on data for all years, including only cities with at least 500 fire incidents)
| South Gate: | 5 minutes |
| Lynwood: | 4 minutes |
| Bell: | 5 minutes |
| Bell Gardens: | 5 minutes |
| Huntington Park: | 4 minutes |
| Paramount: | 5 minutes |
| Downey: | 7 minutes |
| Compton: | 6 minutes |
| Vernon: | 5 minutes |
 35.6% incidents where reported in the morning and 64.4% in the evening. The most fires (16.1%) took place on Saturday, and the least (12.7%) on Monday.
 Based on the 1,648 fire incident reports from years 2005 - 2018 most fires (15.4%) took place during January, and the least (6.0%) in October.
 Out of all 26,040 cases reported during the years 2005 - 2018, the most belonged to the categories: Rescue & EMS (61.9%), Good Intent Call (22.3%), and Fire (6.3%).
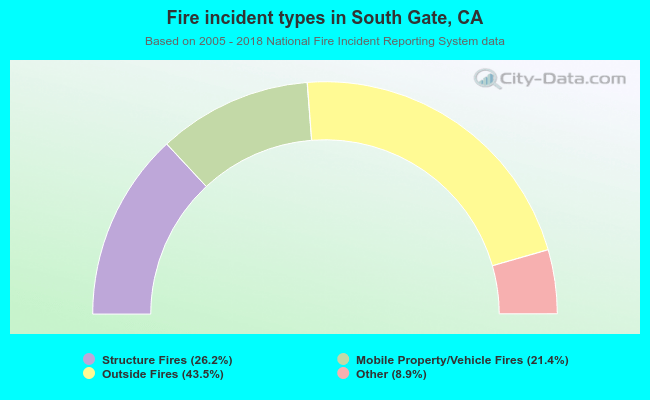 When looking into fire subcategories, the most incidents belonged to: Outside Fires (43.5%), and Structure Fires (26.2%).