Cudahy: Fire Incidents, California (CA)
Where are fire incidents reported in Cudahy, CA
Something went wrong! Please refresh the page.
|
| |||||||||||||||||||||||||||||||||||||||||||||||||||||||||
2005 - 2018 National Fire Incident Reporting System (NFIRS) incidents
- Incident types reported to NFIRS in Cudahy, CA
- 4,33869.4%Rescue & EMS
- 99816.0%Good Intent Call
- 3796.1%False Alarm
- 3415.5%Fire
- 1222.0%Hazardous Condition
- 671.1%Service Call
- Fire incident types reported to NFIRS in Cudahy, CA
- 12235.8%Outside Fires
- 11132.6%Structure Fires
- 6819.9%Other
- 4011.7%Mobile Property/Vehicle Fires
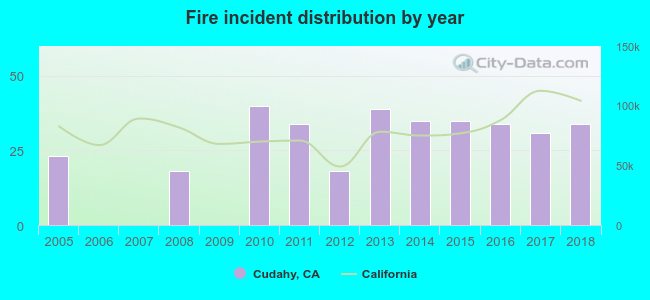 Based on the data from the years 2005 - 2018 the average number of fires per year is 24. The highest number of reported fire incidents - 40 took place in 2010, and the least - 0 in 2006. The data has a rising trend.
The average number of yearly fire incidents per 10k residents in Cudahy, CA compared to nearest cities:
(Note: Based on data for the last 3 years, including only cities with population 5,000 and above)
| Cudahy: | 13.6 |
| Bell: | 19.0 |
| Bell Gardens: | 18.3 |
| South Gate: | 15.8 |
| Maywood: | 12.2 |
| Huntington Park: | 19.9 |
| Walnut Park: | 11.5 |
| Lynwood: | 19.4 |
| Commerce: | 70.9 |

 31.4% incidents where reported in the morning and 68.6% in the evening. The most fires (17.9%) took place on Sunday, and the least (8.8%) on Friday.
 According to the 341 fire incident reports from years 2005 - 2018 most fires (29.0%) took place during January, and the least (5.6%) in July.
 Out of all 6,252 cases reported during the years 2005 - 2018, the most belonged to the categories: Rescue & EMS (69.4%), Good Intent Call (16.0%), and False Alarm (6.1%).
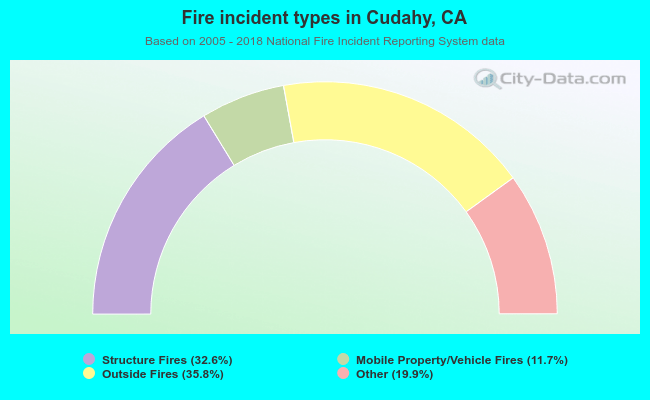 When looking into fire subcategories, the most reports belonged to: Outside Fires (35.8%), and Structure Fires (32.6%).