Vicksburg: Fire Incidents, Mississippi (MS)
Where are fire incidents reported in Vicksburg, MS
Something went wrong! Please refresh the page.
| Fire incidents reported | |
|---|---|
| Sreet name | Count |
| WASHINGTON ST | 200 |
| HALLS FERRY RD | 180 |
| CLAY ST | 134 |
| FRONTAGE RD | 124 |
| I20 HWY | 116 |
| FISHER FERRY RD | 100 |
| GROVE ST | 94 |
| HWY 80 | 94 |
| 61 HWY | 80 |
| OAK ST | 76 |
| HWY 61 | 72 |
| HIGHWAY 3 | 68 |
| OAK RIDGE RD | 66 |
| BOWMAR AVE | 60 |
| CRAWFORD ST | 60 |
| HWY 61 S | 56 |
| SOUTH ST | 56 |
| HWY 27 | 54 |
| I-20 | 54 |
| DANA RD | 50 |
| WARRENTON RD | 50 |
| CHERRY ST | 48 |
| GIBSON RD | 48 |
| BLOSSOM LN | 46 |
| CULKIN RD | 46 |
| HWY 61 N | 46 |
| STANDARD HILL RD | 46 |
| HWY 465 | 44 |
| BERRYMAN RD | 42 |
| ALCORN DR | 40 |
| Other | 2,794 |
2002 - 2018 National Fire Incident Reporting System (NFIRS) incidents
- Incident types reported to NFIRS in Vicksburg, MS
- 13,89046.1%Rescue & EMS
- 6,39121.2%Good Intent Call
- 5,04416.8%Fire
- 2,3157.7%Hazardous Condition
- 1,2424.1%False Alarm
- 1,0923.6%Service Call
- 480.2%Special Incident
- 470.2%Overpressure Rupture
- 340.1%Severe Weather
- Fire incident types reported to NFIRS in Vicksburg, MS
- 2,11341.9%Structure Fires
- 1,57131.1%Outside Fires
- 99619.7%Mobile Property/Vehicle Fires
- 3647.2%Other
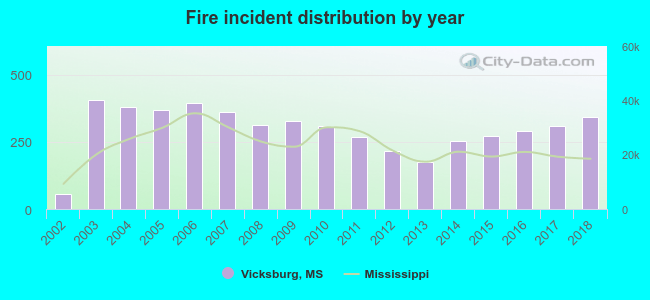 According to the data from the years 2002 - 2018 the average number of fire incidents per year is 297. The highest number of reported fires - 405 took place in 2003, and the least - 56 in 2002. The data has a growing trend.
The average number of yearly fire incidents per 10k residents in Vicksburg, MS compared to nearest cities:
(Note: Based on data for the last 3 years, including only cities with population 5,000 and above)
| Vicksburg: | 134.1 |
| Clinton: | 27.8 |
| Byram: | 51.3 |
| Jackson: | 25.9 |
| Richland: | 54.7 |
| Ridgeland: | 34.4 |
| Flowood: | 56.9 |
| Yazoo City: | 108.5 |
| Pearl: | 32.7 |
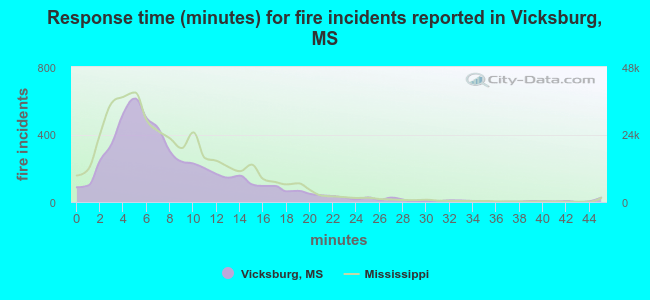 The median response time based on all reported fire incidents is 7 minutes. This is comparable to the Mississippi median value.
The median response time in Vicksburg, MS compared to nearest cities:
(Note: Based on data for all years, including only cities with at least 500 fire incidents)
| Vicksburg: | 7 minutes |
| Tallulah: | 4 minutes |
| Utica: | 11 minutes |
| Bolton: | 8 minutes |
| Port Gibson: | 7 minutes |
| Raymond: | 8 minutes |
| Clinton: | 5 minutes |
| Flora: | 8 minutes |
| Bentonia: | 11 minutes |
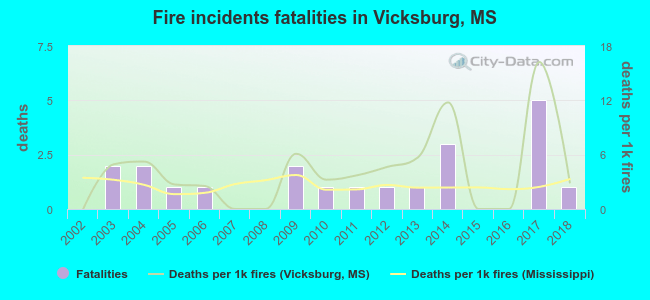 According to the data from the years 2002 - 2018 the average number of fire-related yearly deaths is 1. The highest number of reported deaths - 5 took place in 2017, and the lowest - 0 in 2002. The data has a rising trend.
The average number of deaths per 1,000 fire incidents is 4. This indicator was the highest - 16 in 2017, and the lowest 0 in 2002. The trend for fatalities per 1,000 fires is growing. Compared to the state value the number of fatalities per 1,000 fires is higher.
According to the data from the years 2002 - 2018 the average number of fire-related yearly deaths is 1. The highest number of reported deaths - 5 took place in 2017, and the lowest - 0 in 2002. The data has a rising trend.
The average number of deaths per 1,000 fire incidents is 4. This indicator was the highest - 16 in 2017, and the lowest 0 in 2002. The trend for fatalities per 1,000 fires is growing. Compared to the state value the number of fatalities per 1,000 fires is higher.Deaths per 1,000 incidents in Vicksburg, MS compared to nearest cities:
(Note: Based on data for all years, including only cities with at least 2,500 fire incidents)
| Vicksburg: | 4.2 |
| Jackson: | 2.1 |
| Brandon: | 1.5 |
| Canton: | 1.2 |
| Brookhaven: | 0.3 |
| Natchez: | 4.3 |
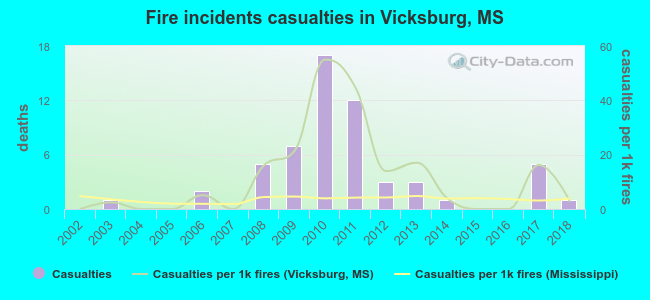 Based on the reports from the years 2002 - 2018 the average number of fire-related casualties per year is 3. The highest number of reported injuries - 17 took place in 2010, and the lowest - 0 in 2002. The data has a growing trend.
The average number of casualties per 1,000 fires is 12. This indicator was the highest - 55 in 2010, and the lowest 0 in 2002. The trend for injuries per 1,000 fires is increasing. Compared to the Mississippi value the number of casualties per 1,000 fires is much higher.
Based on the reports from the years 2002 - 2018 the average number of fire-related casualties per year is 3. The highest number of reported injuries - 17 took place in 2010, and the lowest - 0 in 2002. The data has a growing trend.
The average number of casualties per 1,000 fires is 12. This indicator was the highest - 55 in 2010, and the lowest 0 in 2002. The trend for injuries per 1,000 fires is increasing. Compared to the Mississippi value the number of casualties per 1,000 fires is much higher.
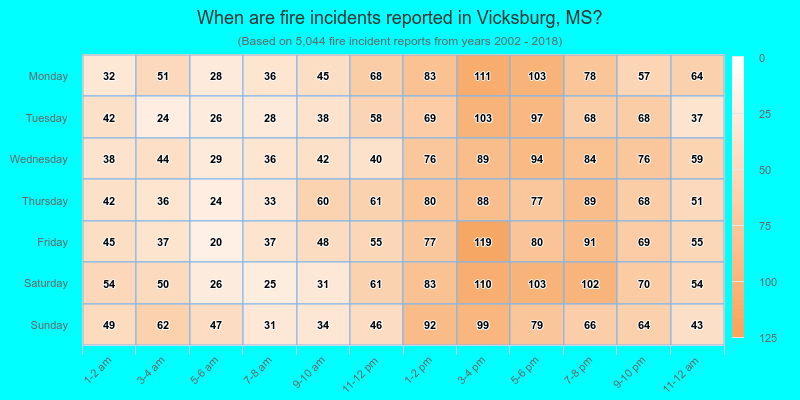
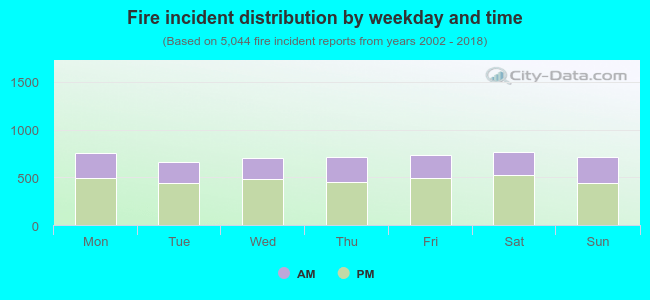 34.1% incidents where reported in the morning and 65.9% in the evening. The most fires (15.2%) took place on Saturday, and the least (13.0%) on Tuesday.
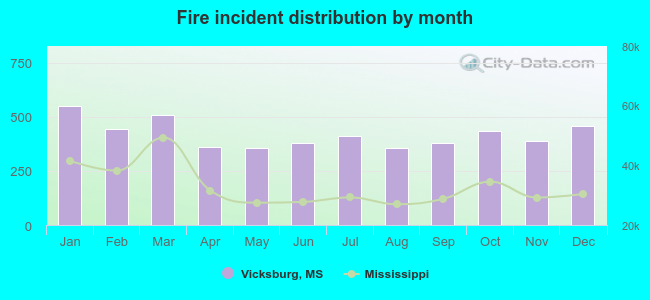 Based on the 5,044 fires from years 2002 - 2018 most fires (10.9%) took place during January, and the least (7.1%) in May.
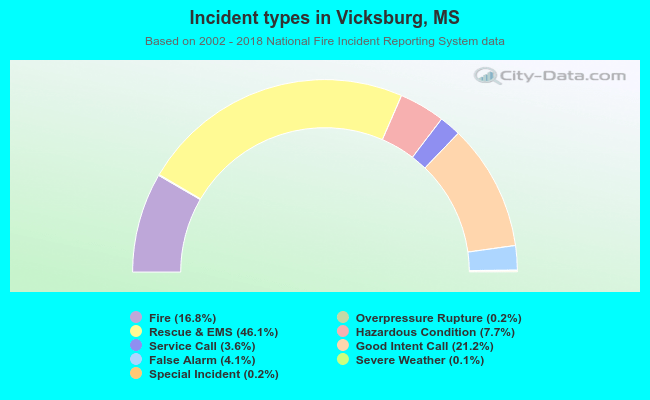 Out of all 30,103 cases reported during the years 2002 - 2018, the most belonged to the categories: Rescue & EMS (46.1%), Good Intent Call (21.2%), and Fire (16.8%).
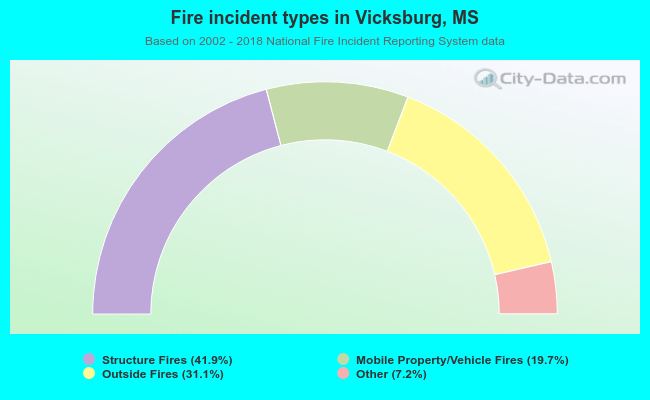 When looking into fire subcategories, the most reports belonged to: Structure Fires (41.9%), and Outside Fires (31.1%).