Canton: Fire Incidents, Mississippi (MS)
Where are fire incidents reported in Canton, MS
Something went wrong! Please refresh the page.
| Fire incidents reported | |
|---|---|
| Sreet name | Count |
| PEACE ST | 190 |
| RICKS DR | 112 |
| LIBERTY ST | 102 |
| HWY 43 | 98 |
| YANDELL RD | 86 |
| ACADEMY ST | 82 |
| INTERSTATE 55 | 78 |
| 16 HWY | 74 |
| 43 HWY | 74 |
| MACE ST | 74 |
| WAY RD | 72 |
| HWY 16 | 68 |
| CANAL ST | 66 |
| FULTON ST | 66 |
| I55 | 66 |
| HIGHWAY 16 | 64 |
| 55 HWY | 58 |
| SHARON RD | 56 |
| OLD CANTON RD | 52 |
| DINKINS ST | 44 |
| HIGHWAY 43 | 44 |
| HOLMES AVE | 42 |
| HWY 51 | 42 |
| PISGAH BOTTOM RD | 42 |
| NISSAN PKY | 38 |
| LINKS DR | 36 |
| 51 HWY | 34 |
| HWY 17 | 34 |
| KING RANCH RD | 34 |
| I-55 | 32 |
| Other | 1,461 |
2003 - 2018 National Fire Incident Reporting System (NFIRS) incidents
- Incident types reported to NFIRS in Canton, MS
- 12,05465.0%Rescue & EMS
- 3,42118.5%Fire
- 1,1566.2%Good Intent Call
- 7033.8%Service Call
- 6163.3%Hazardous Condition
- 5302.9%False Alarm
- 300.2%Overpressure Rupture
- Fire incident types reported to NFIRS in Canton, MS
- 1,51444.3%Outside Fires
- 1,17334.3%Structure Fires
- 60417.7%Mobile Property/Vehicle Fires
- 1303.8%Other
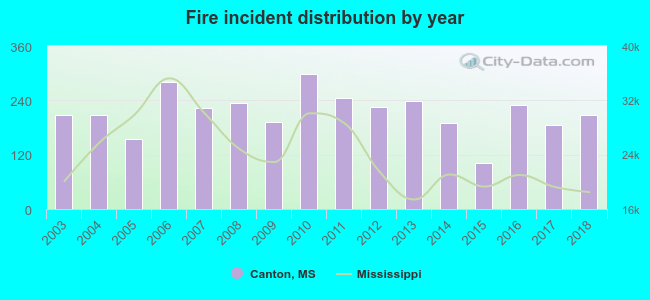 Based on the data from the years 2003 - 2018 the average number of fire incidents per year is 214. The highest number of reported fire incidents - 299 took place in 2010, and the least - 101 in 2015. The data has a dropping trend.
The average number of yearly fire incidents per 10k residents in Canton, MS compared to nearest cities:
(Note: Based on data for the last 3 years, including only cities with population 5,000 and above)
| Canton: | 151.2 |
| Madison: | 40.1 |
| Ridgeland: | 34.4 |
| Flowood: | 56.9 |
| Jackson: | 25.9 |
| Brandon: | 99.6 |
| Pearl: | 32.7 |
| Clinton: | 27.8 |
| Richland: | 54.7 |
 The median response time based on all reported fire incidents is 6 minutes. This is close to the Mississippi median value.
The median response time in Canton, MS compared to nearest cities:
(Note: Based on data for all years, including only cities with at least 500 fire incidents)
| Canton: | 6 minutes |
| Madison: | 5 minutes |
| Ridgeland: | 4 minutes |
| Flora: | 8 minutes |
| Bentonia: | 11 minutes |
| Flowood: | 4 minutes |
| Jackson: | 5 minutes |
| Brandon: | 7 minutes |
| Pearl: | 4 minutes |
 Based on the reports from the years 2003 - 2018 the average number of fire-related yearly deaths is 0. The highest number of reported deaths - 1 took place in 2003, and the lowest - 0 in 2004. The data has a constant trend.
The average number of deaths per 1,000 fires is 1. This indicator was the highest - 5 in 2018, and the lowest 0 in 2004. The trend for fatalities per 1,000 incidents is increasing. Compared to the Mississippi value the number of fatalities per 1,000 fires is much lower.
Based on the reports from the years 2003 - 2018 the average number of fire-related yearly deaths is 0. The highest number of reported deaths - 1 took place in 2003, and the lowest - 0 in 2004. The data has a constant trend.
The average number of deaths per 1,000 fires is 1. This indicator was the highest - 5 in 2018, and the lowest 0 in 2004. The trend for fatalities per 1,000 incidents is increasing. Compared to the Mississippi value the number of fatalities per 1,000 fires is much lower.Deaths per 1,000 incidents in Canton, MS compared to nearest cities:
(Note: Based on data for all years, including only cities with at least 2,500 fire incidents)
| Canton: | 1.2 |
| Jackson: | 2.1 |
| Brandon: | 1.5 |
| Carthage: | 1.9 |
| Vicksburg: | 4.2 |
| Philadelphia: | 6.5 |
 Based on the reports from the years 2003 - 2018 the average number of fire-related yearly casualties is 1. The highest number of casualties - 6 took place in 2009, and the lowest - 0 in 2003. The data has a constant trend.
The average number of casualties per 1,000 fire incidents is 3. This indicator was the highest - 31 in 2009, and the lowest 0 in 2003. The trend for casualties per 1,000 fire incidents is constant. Compared to the Mississippi value the number of casualties per 1,000 fires is similar.
Based on the reports from the years 2003 - 2018 the average number of fire-related yearly casualties is 1. The highest number of casualties - 6 took place in 2009, and the lowest - 0 in 2003. The data has a constant trend.
The average number of casualties per 1,000 fire incidents is 3. This indicator was the highest - 31 in 2009, and the lowest 0 in 2003. The trend for casualties per 1,000 fire incidents is constant. Compared to the Mississippi value the number of casualties per 1,000 fires is similar.
 30.1% incidents where reported in the morning and 69.9% in the evening. The most fires (16.5%) took place on Saturday, and the least (13.2%) on Tuesday.
 Based on the 3,421 fire incidents from years 2003 - 2018 most fires (12.2%) took place during March, and the least (6.1%) in May.
 Out of all 18,535 cases reported during the years 2003 - 2018, the most belonged to the categories: Rescue & EMS (65.0%), Fire (18.5%), and Good Intent Call (6.2%).
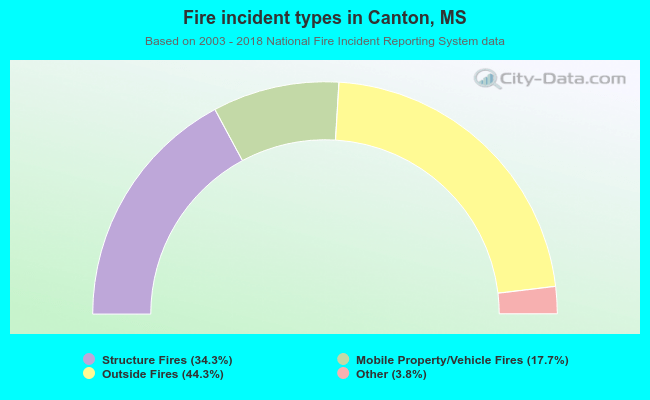 When looking into fire subcategories, the most reports belonged to: Outside Fires (44.3%), and Structure Fires (34.3%).