Natchez: Fire Incidents, Mississippi (MS)
Where are fire incidents reported in Natchez, MS
Something went wrong! Please refresh the page.
| Fire incidents reported | |
|---|---|
| Sreet name | Count |
| HWY 61 | 190 |
| SEARGENT S. PRENTISS DR | 104 |
| LOWER WOODVILLE RD | 98 |
| LIBERTY RD | 90 |
| MARTIN LUTHER KING JR ST | 74 |
| KINGSTON RD | 64 |
| GREENFIELD RD | 62 |
| JOHN R. JUNKIN DR | 62 |
| CRANFIELD RD | 46 |
| MORGANTOWN RD | 42 |
| OAK ST | 40 |
| D'EVEREUX DR | 38 |
| FOSTER MOUND RD | 38 |
| DUCK POND RD | 36 |
| STEAMPLANT RD | 36 |
| UNION ST | 36 |
| DUMAS DR | 34 |
| SEDGEFIELD RD | 34 |
| WILDERNESS RD | 34 |
| CARMEL CHURCH RD | 32 |
| PALESTINE RD | 32 |
| HUTCHINS LANDING RD | 30 |
| MAIN ST | 30 |
| OLD WASHINGTON RD | 30 |
| HWY 61 NORTH | 28 |
| LEWIS DR | 28 |
| COUNTRY CLUB DR | 26 |
| FRANKLIN ST | 26 |
| SPRINGFIELD RD | 26 |
| UPPER KINGSTON RD | 26 |
| Other | 1,289 |
2002 - 2018 National Fire Incident Reporting System (NFIRS) incidents
- Incident types reported to NFIRS in Natchez, MS
- 2,76147.7%Fire
- 1,44224.9%Hazardous Condition
- 62810.8%False Alarm
- 5479.4%Good Intent Call
- 2324.0%Service Call
- 1372.4%Rescue & EMS
- 290.5%Overpressure Rupture
- 100.2%Severe Weather
- Fire incident types reported to NFIRS in Natchez, MS
- 1,02036.9%Outside Fires
- 1,00536.4%Structure Fires
- 69825.3%Mobile Property/Vehicle Fires
- 381.4%Other
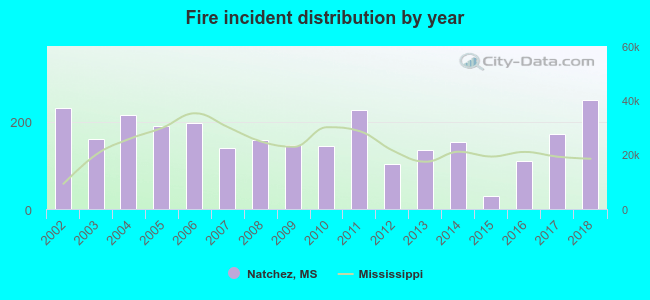 According to the data from the years 2002 - 2018 the average number of fires per year is 162. The highest number of reported fire incidents - 249 took place in 2018, and the least - 29 in 2015. The data has an increasing trend.
The average number of yearly fire incidents per 10k residents in Natchez, MS compared to nearest cities:
(Note: Based on data for the last 3 years, including only cities with population 5,000 and above)
| Natchez: | 115.9 |
| Brookhaven: | 53.5 |
| McComb: | 140.9 |
| Vicksburg: | 134.1 |
 The median response time based on all reported fire incidents is 8 minutes. This is comparable to the state median value.
The median response time in Natchez, MS compared to nearest cities:
(Note: Based on data for all years, including only cities with at least 500 fire incidents)
| Natchez: | 8 minutes |
| Woodville: | 10 minutes |
| Gloster: | 11 minutes |
| Port Gibson: | 7 minutes |
| Liberty: | 11 minutes |
| Jena: | 5 minutes |
| Winnsboro: | 6 minutes |
| Deville: | 10 minutes |
| Brookhaven: | 7 minutes |
 Based on the data from the years 2002 - 2018 the average number of fire-related fatalities per year is 1. The highest number of deaths - 5 took place in 2018, and the lowest - 0 in 2002. The data has a rising trend.
The average number of deaths per 1,000 fire incidents is 4. This indicator was the highest - 20 in 2018, and the lowest 0 in 2002. The trend for fatalities per 1,000 fire incidents is increasing. Compared to the Mississippi value the number of deaths per 1,000 fire incidents is higher.
Based on the data from the years 2002 - 2018 the average number of fire-related fatalities per year is 1. The highest number of deaths - 5 took place in 2018, and the lowest - 0 in 2002. The data has a rising trend.
The average number of deaths per 1,000 fire incidents is 4. This indicator was the highest - 20 in 2018, and the lowest 0 in 2002. The trend for fatalities per 1,000 fire incidents is increasing. Compared to the Mississippi value the number of deaths per 1,000 fire incidents is higher.Deaths per 1,000 incidents in Natchez, MS compared to nearest cities:
(Note: Based on data for all years, including only cities with at least 2,500 fire incidents)
| Natchez: | 4.3 |
| Brookhaven: | 0.3 |
| McComb: | 3.9 |
| Vicksburg: | 4.2 |
| Pineville: | 1.2 |
 According to the data from the years 2002 - 2018 the average number of fire-related yearly casualties is 1. The highest number of reported casualties - 4 took place in 2011, and the lowest - 0 in 2002. The data has a rising trend.
The average number of injuries per 1,000 fire incidents is 5. This indicator was the highest - 29 in 2012, and the lowest 0 in 2002. The trend for casualties per 1,000 fire incidents is growing. Compared to the Mississippi value the number of injuries per 1,000 fire incidents is higher.
According to the data from the years 2002 - 2018 the average number of fire-related yearly casualties is 1. The highest number of reported casualties - 4 took place in 2011, and the lowest - 0 in 2002. The data has a rising trend.
The average number of injuries per 1,000 fire incidents is 5. This indicator was the highest - 29 in 2012, and the lowest 0 in 2002. The trend for casualties per 1,000 fire incidents is growing. Compared to the Mississippi value the number of injuries per 1,000 fire incidents is higher.Casualties per 1,000 incidents in Natchez, MS compared to nearest cities:
(Note: Based on data for all years, including only cities with at least 500 fire incidents)
| Natchez: | 4.7 |
| Woodville: | 0.0 |
| Gloster: | 0.0 |
| Port Gibson: | 3.0 |
| Liberty: | 2.0 |
| Jena: | 1.1 |
| Winnsboro: | 0.0 |
| Deville: | 1.2 |
| Brookhaven: | 0.0 |
 34.2% incidents where reported in the morning and 65.8% in the evening. The most fires (15.2%) took place on Friday, and the least (13.3%) on Sunday.
 Based on the 2,761 fire incident reports from years 2002 - 2018 most fires (12.6%) took place during January, and the least (6.2%) in November.
 Out of all 5,791 cases reported during the years 2002 - 2018, the most belonged to the categories: Fire (47.7%), Hazardous Condition (24.9%), and False Alarm (10.8%).
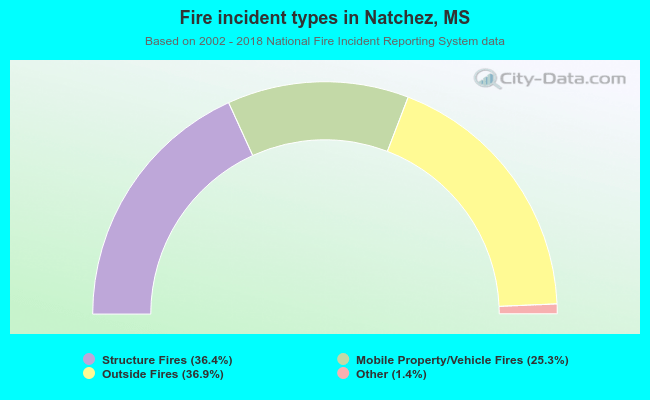 When looking into fire subcategories, the most reports belonged to: Outside Fires (36.9%), and Structure Fires (36.4%).