Tumwater: Fire Incidents, Washington (WA)
Where are fire incidents reported in Tumwater, WA
Something went wrong! Please refresh the page.
| Fire incidents reported | |
|---|---|
| Sreet name | Count |
| CAPITOL BLVD | 184 |
| TROSPER RD | 160 |
| LITTLEROCK RD | 108 |
| ISRAEL RD | 100 |
| MOTTMAN RD | 86 |
| HENDERSON BLVD | 78 |
| 2ND AVE | 68 |
| T ST | 66 |
| TUMWATER BLVD | 64 |
| CLEVELAND AVE | 54 |
| I-5 NORTHBOUND | 50 |
| 54TH AVE | 38 |
| 93RD AVE | 38 |
| I-5 SOUTHBOUND | 38 |
| LEE ST | 38 |
| KIMMIE RD | 36 |
| OLD 99 HWY | 34 |
| 7TH AVE | 30 |
| BONNIEWOOD DR | 28 |
| CUSTER WAY | 28 |
| 88TH AVE | 26 |
| DENNIS ST | 24 |
| IRVING ST | 22 |
| CROSBY BLVD | 20 |
| KIRSOP RD | 20 |
| SAPP RD | 20 |
| 6TH AVE | 18 |
| BLACK LAKE BLVD | 18 |
| CENTER ST | 18 |
| LAKE PARK DR | 18 |
2002 - 2018 National Fire Incident Reporting System (NFIRS) incidents
- Incident types reported to NFIRS in Tumwater, WA
- 14,60868.0%Rescue & EMS
- 1,7618.2%Good Intent Call
- 1,5127.0%Fire
- 1,2435.8%False Alarm
- 1,1785.5%Service Call
- 1,1505.4%Hazardous Condition
- Fire incident types reported to NFIRS in Tumwater, WA
- 72147.7%Structure Fires
- 48432.0%Outside Fires
- 27818.4%Mobile Property/Vehicle Fires
- 291.9%Other
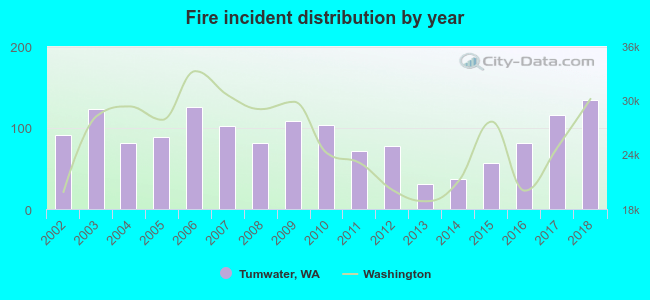 According to the data from the years 2002 - 2018 the average number of fire incidents per year is 89. The highest number of fire incidents - 134 took place in 2018, and the least - 31 in 2013. The data has an increasing trend.
The average number of yearly fire incidents per 10k residents in Tumwater, WA compared to nearest cities:
(Note: Based on data for the last 3 years, including only cities with population 5,000 and above)
| Tumwater: | 58.6 |
| Olympia: | 118.4 |
| Lacey: | 35.4 |
| DuPont: | 2.9 |
| Yelm: | 167.0 |
| Shelton: | 368.9 |
| Steilacoom: | 8.1 |
| Centralia: | 104.3 |
| Lakewood: | 25.9 |
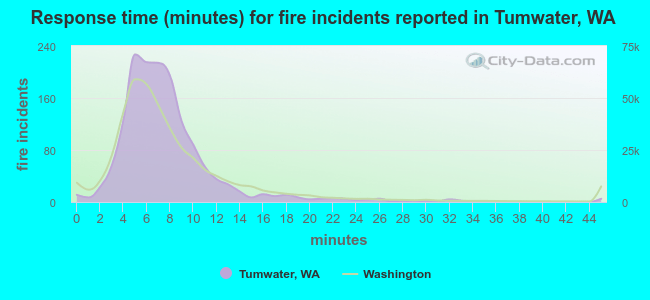 The median response time based on all reported fire incidents is 7 minutes. This is comparable to the state median value.
The median response time in Tumwater, WA compared to nearest cities:
(Note: Based on data for all years, including only cities with at least 500 fire incidents)
| Tumwater: | 7 minutes |
| Olympia: | 7 minutes |
| Lacey: | 6 minutes |
| Tenino: | 10 minutes |
| Yelm: | 10 minutes |
| Rochester: | 9 minutes |
| Shelton: | 9 minutes |
| Roy: | 13 minutes |
| Centralia: | 6 minutes |
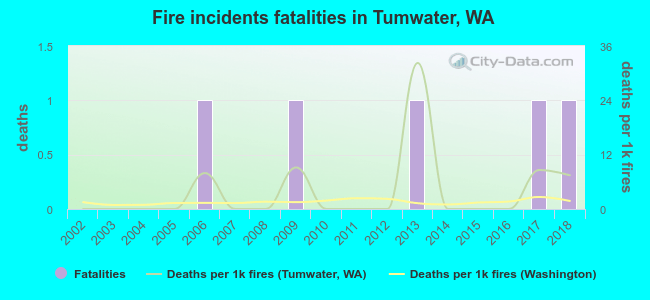 According to the reports from the years 2002 - 2018 the average number of fire-related fatalities per year is 0. The highest number of deaths - 1 took place in 2006, and the lowest - 0 in 2002. The data has a rising trend.
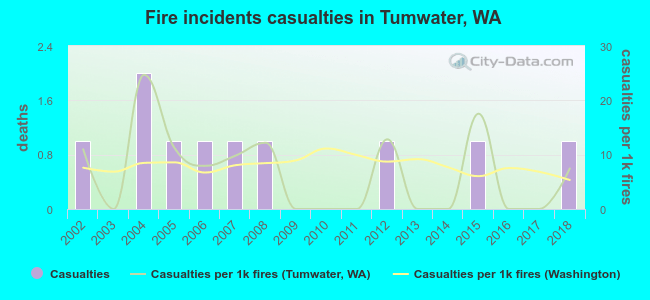 According to the reports from the years 2002 - 2018 the average number of fire-related yearly casualties is 1. The highest number of injuries - 2 took place in 2004, and the lowest - 0 in 2003. The data has a constant trend.
The average number of casualties per 1,000 fires is 7. This indicator was the highest - 25 in 2004, and the lowest 0 in 2003. The trend for injuries per 1,000 incidents is decreasing. Compared to the Washington value the number of casualties per 1,000 fire incidents is about the same.
According to the reports from the years 2002 - 2018 the average number of fire-related yearly casualties is 1. The highest number of injuries - 2 took place in 2004, and the lowest - 0 in 2003. The data has a constant trend.
The average number of casualties per 1,000 fires is 7. This indicator was the highest - 25 in 2004, and the lowest 0 in 2003. The trend for injuries per 1,000 incidents is decreasing. Compared to the Washington value the number of casualties per 1,000 fire incidents is about the same.
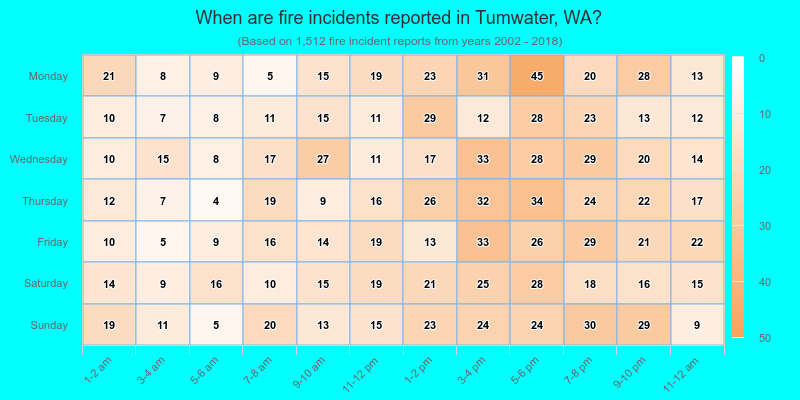
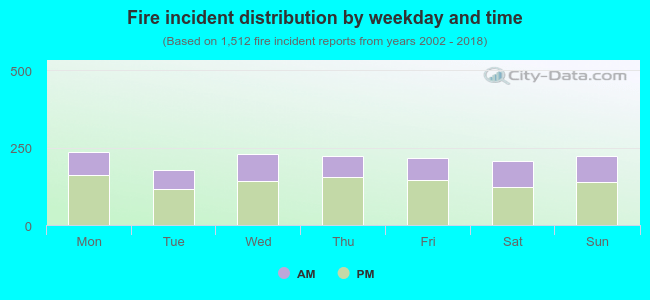 35.3% incidents where reported in the morning and 64.7% in the evening. The most fires (15.7%) took place on Monday, and the least (11.8%) on Tuesday.
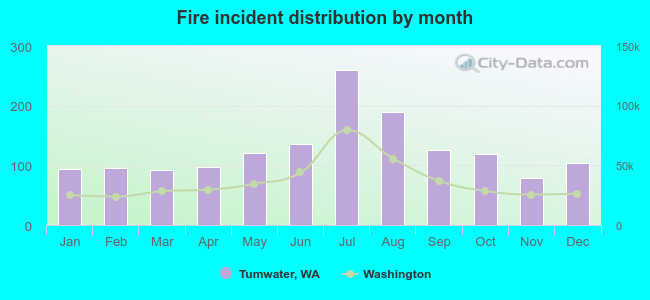 Based on the 1,512 incident reports from years 2002 - 2018 most fires (17.1%) took place during July, and the least (5.2%) in November.
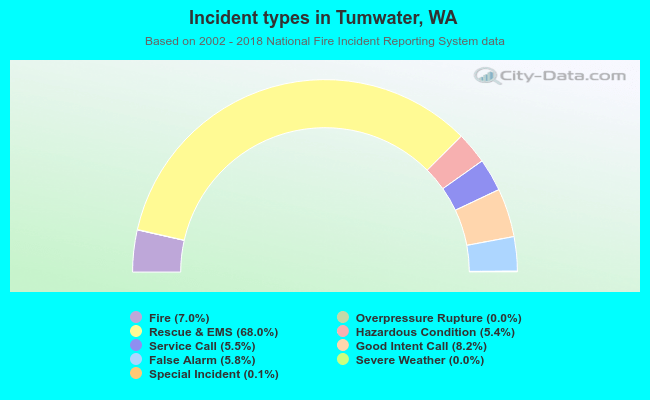 Out of all 21,482 cases reported during the years 2002 - 2018, the most belonged to the categories: Rescue & EMS (68.0%), Good Intent Call (8.2%), and Fire (7.0%).
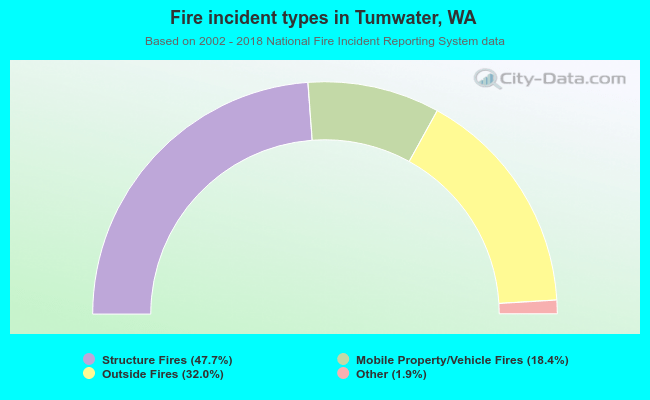 When looking into fire subcategories, the most incidents belonged to: Structure Fires (47.7%), and Outside Fires (32.0%).