Sullivan: Fire Incidents, Missouri (MO)
Where are fire incidents reported in Sullivan, MO
Something went wrong! Please refresh the page.
| Fire incidents reported | |
|---|---|
| Sreet name | Count |
| SERVICE RD | 128 |
| SPRINGFIELD RD | 94 |
| HWY 185 | 88 |
| I44 | 68 |
| HWY H | 62 |
| HWY WW | 58 |
| I-44 | 58 |
| HWY A | 42 |
| SPRINGFIELD | 42 |
| SEMINARY RD | 38 |
| ELMONT RD | 34 |
| CHAPEL HILL RD | 30 |
| I - 44 | 28 |
| SAPPINGTON BRIDGE RD | 26 |
| WATSON RD | 26 |
| HWY AF | 24 |
| HIGHWAY 185 | 22 |
| INTERSTATE 44 | 22 |
| ACORN RD | 20 |
| HAMILTON HOLLOW RD | 20 |
| HIGHWAY K | 20 |
| HWY D | 20 |
| I44 HWY | 20 |
| PARK ST | 20 |
| VINE ST | 20 |
| OLIVE ST | 18 |
| ACID MINE RD | 16 |
| HWY 185 SPUR | 16 |
| HWY J | 16 |
| IRA BLAND ST | 16 |
| Other | 876 |
2002 - 2018 National Fire Incident Reporting System (NFIRS) incidents
- Incident types reported to NFIRS in Sullivan, MO
- 2,02426.6%Rescue & EMS
- 1,98826.1%Fire
- 1,94625.6%Hazardous Condition
- 84511.1%Good Intent Call
- 3945.2%Service Call
- 3865.1%False Alarm
- 160.2%Severe Weather
- 130.2%Special Incident
- Fire incident types reported to NFIRS in Sullivan, MO
- 91045.8%Outside Fires
- 62431.4%Structure Fires
- 32516.3%Mobile Property/Vehicle Fires
- 1296.5%Other
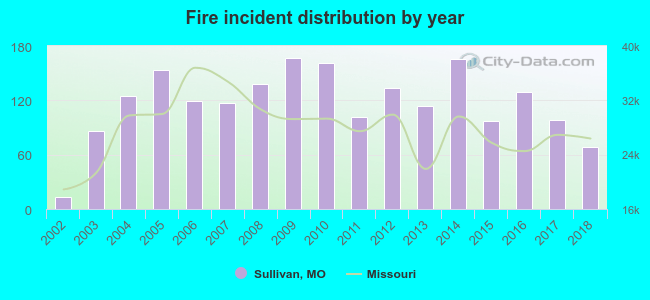 Based on the data from the years 2002 - 2018 the average number of fires per year is 117. The highest number of fires - 167 took place in 2009, and the least - 13 in 2002. The data has a growing trend.
The average number of yearly fire incidents per 10k residents in Sullivan, MO compared to nearest cities:
(Note: Based on data for the last 3 years, including only cities with population 5,000 and above)
| Sullivan: | 139.9 |
| Union: | 74.9 |
| Washington: | 40.2 |
| Pacific: | 45.0 |
| De Soto: | 178.2 |
| Eureka: | 47.4 |
| Rolla: | 34.5 |
| Wildwood: | 16.8 |
| Bonne Terre: | 166.4 |
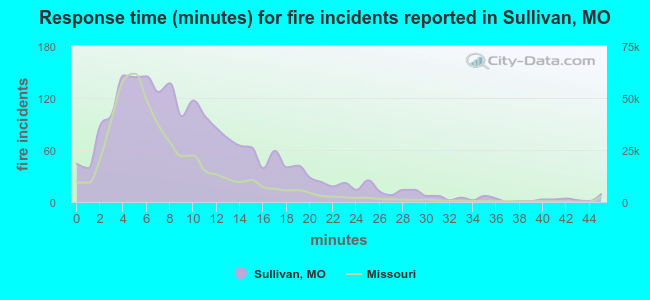 The median response time based on all reported fire incidents is 9 minutes. This is higher than the Missouri median value.
The median response time in Sullivan, MO compared to nearest cities:
(Note: Based on data for all years, including only cities with at least 500 fire incidents)
| Sullivan: | 9 minutes |
| Bourbon: | 10 minutes |
| Gerald: | 11 minutes |
| Cuba: | 10 minutes |
| Union: | 8 minutes |
| Steelville: | 13 minutes |
| Owensville: | 11 minutes |
| Washington: | 4 minutes |
| Potosi: | 13 minutes |
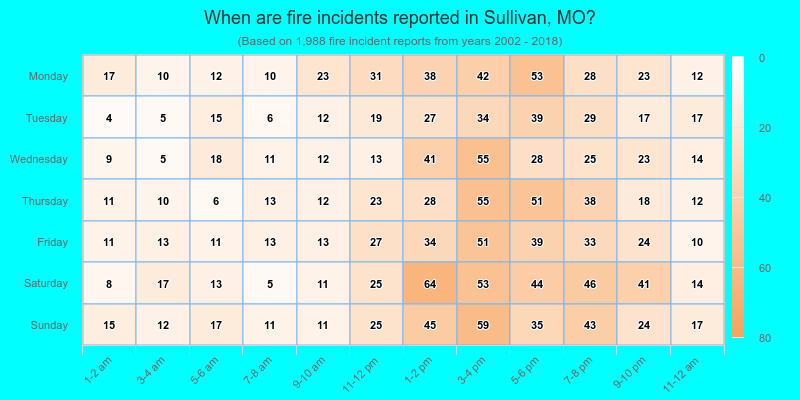
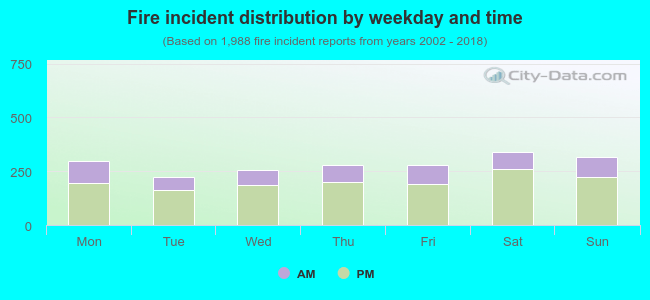 28.4% incidents where reported in the morning and 71.6% in the evening. The most fires (17.2%) took place on Saturday, and the least (11.3%) on Tuesday.
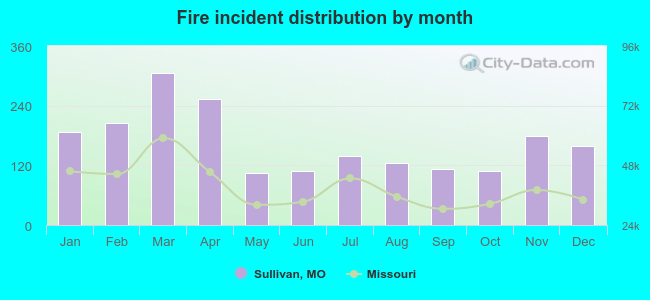 According to the 1,988 reports from years 2002 - 2018 most fires (15.4%) took place during March, and the least (5.3%) in May.
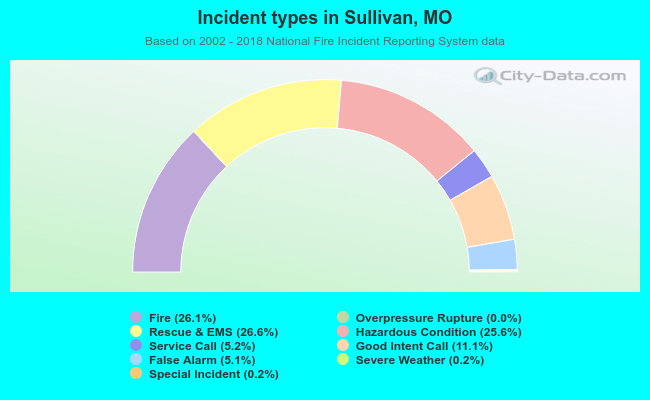 Out of all 7,614 cases reported during the years 2002 - 2018, the most belonged to the categories: Rescue & EMS (26.6%), Fire (26.1%), and Hazardous Condition (25.6%).
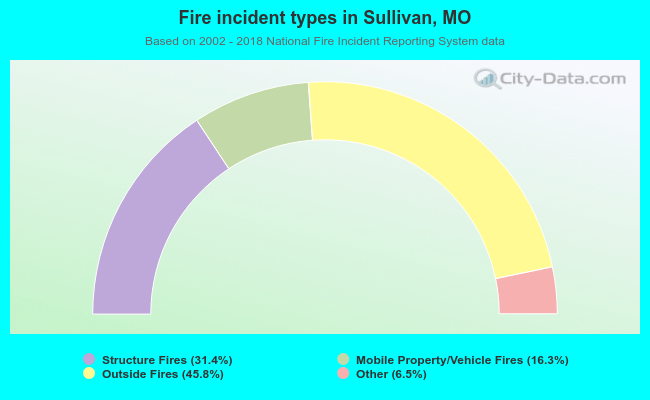 When looking into fire subcategories, the most reports belonged to: Outside Fires (45.8%), and Structure Fires (31.4%).