Rolla: Fire Incidents, Missouri (MO)
Where are fire incidents reported in Rolla, MO
Something went wrong! Please refresh the page.
| Fire incidents reported | |
|---|---|
| Sreet name | Count |
| BISHOP AVE | 138 |
| INTERSTATE 44 | 124 |
| HWY 63 | 78 |
| STATE HIGHWAY 72 | 66 |
| FORUM DR | 56 |
| PINE ST | 46 |
| HWY 72 | 38 |
| ROLLA ST | 30 |
| 11TH ST | 28 |
| CR 2030 | 28 |
| 10TH | 26 |
| MCCUTCHEN DR | 26 |
| HWY E | 24 |
| I-44 | 24 |
| OO HWY | 24 |
| 12TH ST | 22 |
| CR 7000 | 22 |
| HWY F | 22 |
| VICHY RD | 22 |
| CR 2020 | 20 |
| ELM ST | 20 |
| KINGSHIGHWAY | 20 |
| 10TH ST | 18 |
| CR 8240 | 18 |
| FARRAR DR | 18 |
| HWY CC | 18 |
| STATE ST | 18 |
| CR 3110 | 16 |
| CR 7240 | 16 |
| HWY V | 16 |
| Other | 601 |
2002 - 2018 National Fire Incident Reporting System (NFIRS) incidents
- Incident types reported to NFIRS in Rolla, MO
- 2,27030.6%Rescue & EMS
- 1,64322.1%Fire
- 1,51220.4%Hazardous Condition
- 82111.1%False Alarm
- 6959.4%Good Intent Call
- 4095.5%Service Call
- 330.4%Special Incident
- 240.3%Overpressure Rupture
- 140.2%Severe Weather
- Fire incident types reported to NFIRS in Rolla, MO
- 77847.4%Outside Fires
- 54233.0%Structure Fires
- 20912.7%Mobile Property/Vehicle Fires
- 1146.9%Other
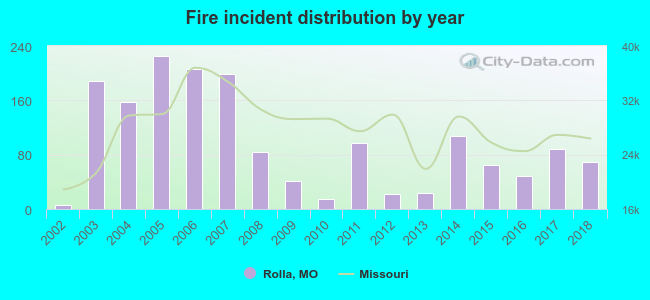 Based on the data from the years 2002 - 2018 the average number of fire incidents per year is 97. The highest number of fire incidents - 226 took place in 2005, and the least - 6 in 2002. The data has an increasing trend.
The average number of yearly fire incidents per 10k residents in Rolla, MO compared to nearest cities:
(Note: Based on data for the last 3 years, including only cities with population 5,000 and above)
| Rolla: | 34.5 |
| Salem: | 91.2 |
| Waynesville: | 128.0 |
| Sullivan: | 139.9 |
| Jefferson City: | 22.0 |
| Lebanon: | 42.1 |
| Union: | 74.9 |
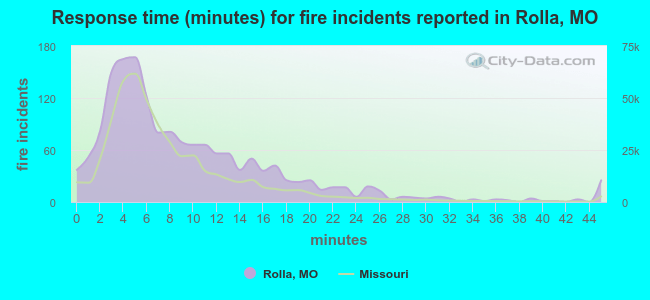 The median response time based on all reported fire incidents is 7 minutes. This is similar to the state median value.
The median response time in Rolla, MO compared to nearest cities:
(Note: Based on data for all years, including only cities with at least 500 fire incidents)
| Rolla: | 7 minutes |
| Dixon: | 12 minutes |
| Cuba: | 10 minutes |
| Steelville: | 13 minutes |
| Salem: | 14 minutes |
| Waynesville: | 10 minutes |
| Crocker: | 9 minutes |
| Owensville: | 11 minutes |
| Bourbon: | 10 minutes |
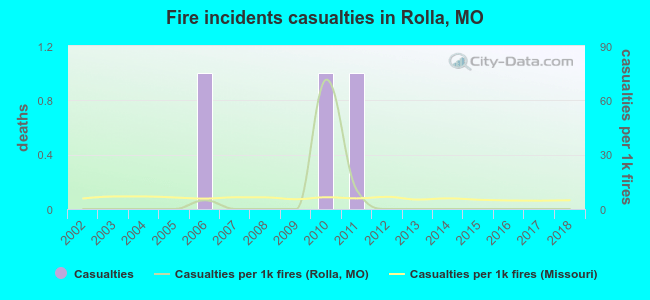 Based on the data from the years 2002 - 2018 the average number of fire-related yearly casualties is 0. The highest number of reported injuries - 1 took place in 2006, and the lowest - 0 in 2002. The data has a constant trend.
The average number of injuries per 1,000 fires is 5. This indicator was the highest - 71 in 2010, and the lowest 0 in 2002. The trend for casualties per 1,000 fire incidents is constant. Compared to the Missouri value the number of casualties per 1,000 fires is much lower.
Based on the data from the years 2002 - 2018 the average number of fire-related yearly casualties is 0. The highest number of reported injuries - 1 took place in 2006, and the lowest - 0 in 2002. The data has a constant trend.
The average number of injuries per 1,000 fires is 5. This indicator was the highest - 71 in 2010, and the lowest 0 in 2002. The trend for casualties per 1,000 fire incidents is constant. Compared to the Missouri value the number of casualties per 1,000 fires is much lower.Casualties per 1,000 incidents in Rolla, MO compared to nearest cities:
(Note: Based on data for all years, including only cities with at least 500 fire incidents)
| Rolla: | 1.8 |
| Dixon: | 0.0 |
| Cuba: | 0.0 |
| Steelville: | 0.0 |
| Salem: | 0.0 |
| Waynesville: | 0.0 |
| Crocker: | 0.0 |
| Owensville: | 0.0 |
| Bourbon: | 0.0 |
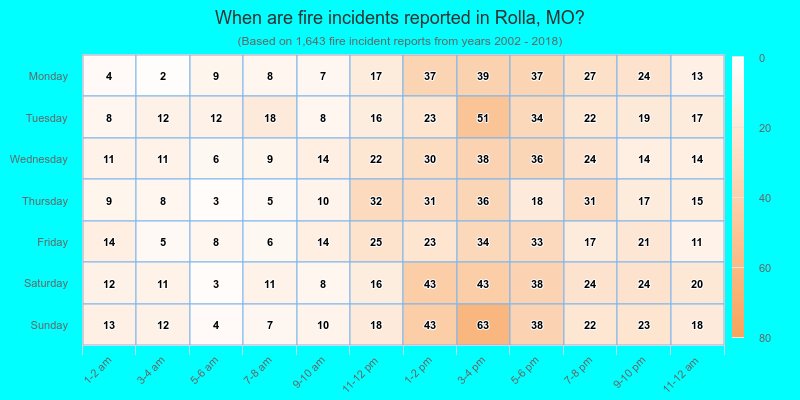
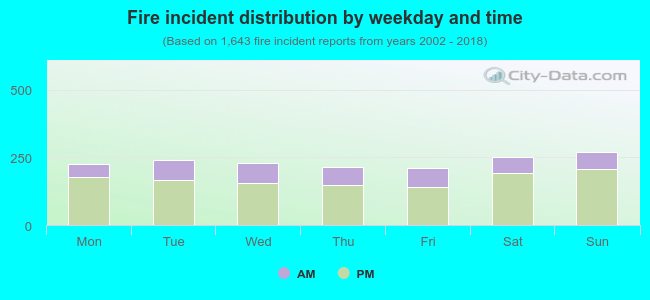 27.9% incidents where reported in the morning and 72.1% in the evening. The most fires (16.5%) took place on Sunday, and the least (12.8%) on Friday.
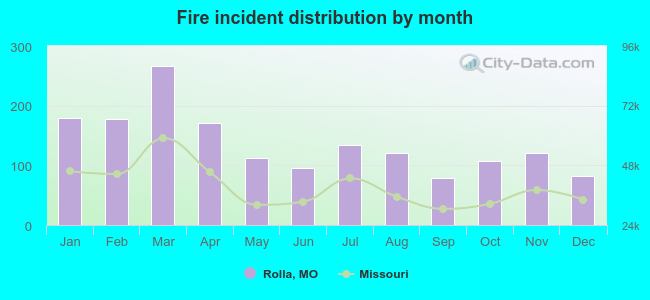 According to the 1,643 reports from years 2002 - 2018 most fires (16.2%) took place during March, and the least (4.7%) in September.
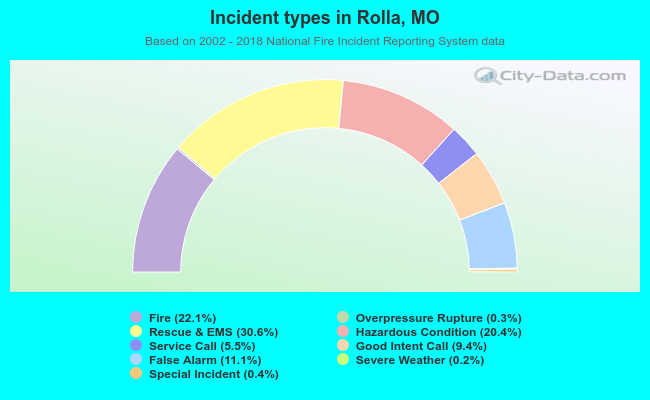 Out of all 7,421 cases reported during the years 2002 - 2018, the most belonged to the categories: Rescue & EMS (30.6%), Fire (22.1%), and Hazardous Condition (20.4%).
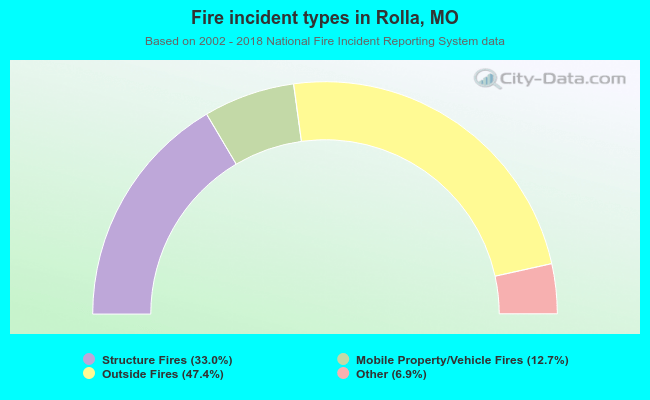 When looking into fire subcategories, the most incidents belonged to: Outside Fires (47.4%), and Structure Fires (33.0%).