Wildwood: Fire Incidents, Missouri (MO)
Where are fire incidents reported in Wildwood, MO
Something went wrong! Please refresh the page.
| Fire incidents reported | |
|---|---|
| Sreet name | Count |
| HIGHWAY 109 | 88 |
| MANCHESTER RD | 68 |
| WILD HORSE CREEK RD | 42 |
| HIGHWAY 100 | 40 |
| MANCHESTER RD | 38 |
| CLAYTON RD | 20 |
| SANDALWOOD CREEK DR | 20 |
| STRECKER RD | 20 |
| WESTGLEN FARMS DR | 18 |
| OLD STATE RD | 16 |
| WILD HORSE CREEK RD | 16 |
| BABLER STATE PARK | 14 |
| CENTAUR RD | 14 |
| OLD STATE RD | 14 |
| BABLER PARK DR | 12 |
| FOX CREEK RD | 12 |
| JOHNS CABIN RD | 12 |
| MELROSE RD | 12 |
| ST ALBANS RD | 12 |
| STRECKER RD | 12 |
| ALLENTON RD | 10 |
| BABLER PARK DR | 10 |
| COUNTRY POINT CT | 10 |
| FOREST LEAF PKWY | 10 |
| HARDT RD | 10 |
| HAWKS POINT RD | 10 |
| MELROSE RD E | 10 |
| POND RD | 10 |
| SHEPARD RD | 10 |
| TAYLOR RD | 10 |
| Other | 361 |
2003 - 2018 National Fire Incident Reporting System (NFIRS) incidents
- Incident types reported to NFIRS in Wildwood, MO
- 5,49756.8%Rescue & EMS
- 1,01410.5%Hazardous Condition
- 9619.9%Fire
- 8949.2%False Alarm
- 6696.9%Service Call
- 5916.1%Good Intent Call
- 300.3%Severe Weather
- 110.1%Overpressure Rupture
- Fire incident types reported to NFIRS in Wildwood, MO
- 45647.5%Outside Fires
- 37138.6%Structure Fires
- 9910.3%Mobile Property/Vehicle Fires
- 353.6%Other
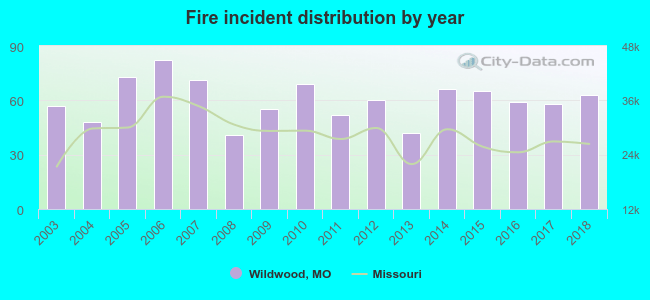 Based on the data from the years 2003 - 2018 the average number of fire incidents per year is 60. The highest number of fire incidents - 82 took place in 2006, and the least - 41 in 2008. The data has a growing trend.
The average number of yearly fire incidents per 10k residents in Wildwood, MO compared to nearest cities:
(Note: Based on data for the last 3 years, including only cities with population 5,000 and above)
| Wildwood: | 16.8 |
| Ellisville: | 55.8 |
| Eureka: | 47.4 |
| Ballwin: | 19.2 |
| Chesterfield: | 24.5 |
| Manchester: | 15.8 |
| Pacific: | 45.0 |
| Valley Park: | 33.4 |
| Weldon Spring: | 1.8 |
 The median response time based on all reported fire incidents is 6 minutes. This is about the same as the Missouri median value.
The median response time in Wildwood, MO compared to nearest cities:
(Note: Based on data for all years, including only cities with at least 500 fire incidents)
| Wildwood: | 6 minutes |
| Ellisville: | 4 minutes |
| Eureka: | 8 minutes |
| Ballwin: | 5 minutes |
| Chesterfield: | 6 minutes |
| Manchester: | 5 minutes |
| Pacific: | 7 minutes |
| Valley Park: | 6 minutes |
| High Ridge: | 6 minutes |
 Based on the reports from the years 2003 - 2018 the average number of fire-related yearly casualties is 0. The highest number of casualties - 1 took place in 2009, and the lowest - 0 in 2003. The data has a constant trend.
The average number of injuries per 1,000 fire incidents is 4. This indicator was the highest - 18 in 2009, and the lowest 0 in 2003. The trend for casualties per 1,000 incidents is constant. Compared to the state value the number of injuries per 1,000 fire incidents is lower.
Based on the reports from the years 2003 - 2018 the average number of fire-related yearly casualties is 0. The highest number of casualties - 1 took place in 2009, and the lowest - 0 in 2003. The data has a constant trend.
The average number of injuries per 1,000 fire incidents is 4. This indicator was the highest - 18 in 2009, and the lowest 0 in 2003. The trend for casualties per 1,000 incidents is constant. Compared to the state value the number of injuries per 1,000 fire incidents is lower.Casualties per 1,000 incidents in Wildwood, MO compared to nearest cities:
(Note: Based on data for all years, including only cities with at least 500 fire incidents)
| Wildwood: | 4.2 |
| Ellisville: | 12.1 |
| Eureka: | 15.1 |
| Ballwin: | 9.9 |
| Chesterfield: | 7.0 |
| Manchester: | 10.1 |
| Pacific: | 5.5 |
| Valley Park: | 4.4 |
| High Ridge: | 6.3 |
 29.0% incidents where reported in the morning and 71.0% in the evening. The most fires (17.8%) took place on Monday, and the least (9.9%) on Wednesday.
 According to the 961 fires from years 2003 - 2018 most fires (12.9%) took place during March, and the least (5.6%) in August.
 Out of all 9,676 cases reported during the years 2003 - 2018, the most belonged to the categories: Rescue & EMS (56.8%), Hazardous Condition (10.5%), and Fire (9.9%).
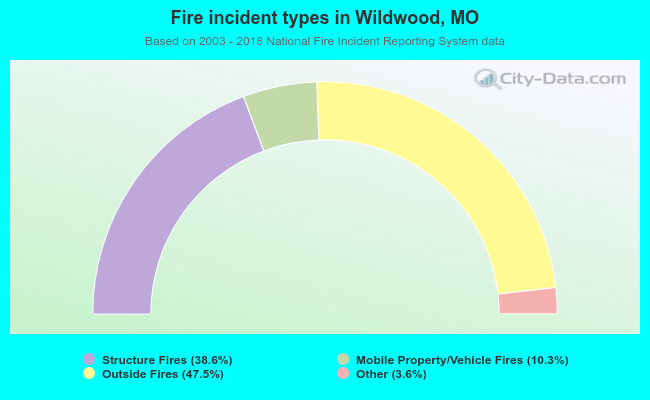 When looking into fire subcategories, the most reports belonged to: Outside Fires (47.5%), and Structure Fires (38.6%).