Valley Park: Fire Incidents, Missouri (MO)
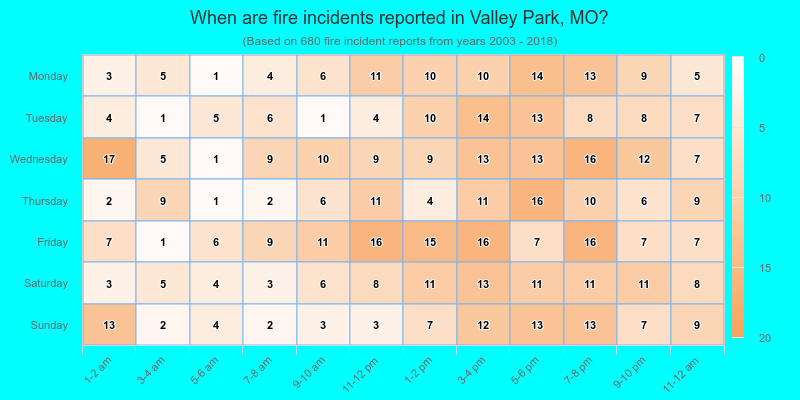
Where are fire incidents reported in Valley Park, MO
Something went wrong! Please refresh the page.
|
| |||||||||||||||||||||||||||||||||||||||||||||||||||||||||||||||||||||||||||||||||||||||||||||||||||||||||||||
| Other | 30 | |||||||||||||||||||||||||||||||||||||||||||||||||||||||||||||||||||||||||||||||||||||||||||||||||||||||||||||
2003 - 2018 National Fire Incident Reporting System (NFIRS) incidents
- Incident types reported to NFIRS in Valley Park, MO
- 2,56654.8%Rescue & EMS
- 68014.5%Fire
- 57012.2%Good Intent Call
- 3337.1%Hazardous Condition
- 2625.6%Service Call
- 2565.5%False Alarm
- 70.1%Overpressure Rupture
- 60.1%Special Incident
- Fire incident types reported to NFIRS in Valley Park, MO
- 33549.3%Structure Fires
- 16624.4%Outside Fires
- 11016.2%Mobile Property/Vehicle Fires
- 6910.1%Other
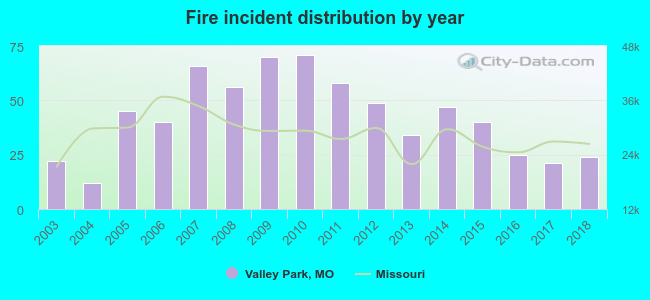 According to the data from the years 2003 - 2018 the average number of fire incidents per year is 43. The highest number of reported fire incidents - 71 took place in 2010, and the least - 12 in 2004. The data has an increasing trend.
The average number of yearly fire incidents per 10k residents in Valley Park, MO compared to nearest cities:
(Note: Based on data for the last 3 years, including only cities with population 5,000 and above)
| Valley Park: | 33.4 |
| Manchester: | 15.8 |
| Des Peres: | 19.9 |
| Ballwin: | 19.2 |
| Kirkwood: | 26.6 |
| Sunset Hills: | 39.5 |
| Town and Country: | 26.1 |
| Ellisville: | 55.8 |
| Crestwood: | 22.6 |
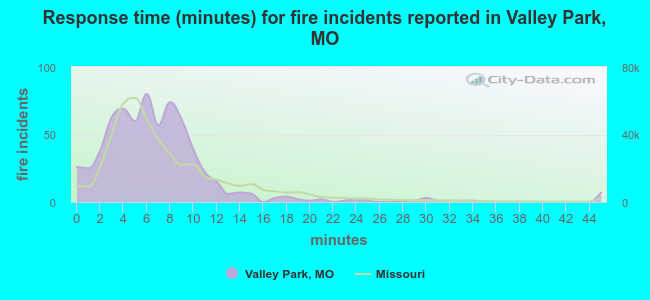 The median response time based on all reported fire incidents is 6 minutes. This is comparable to the state median value.
The median response time in Valley Park, MO compared to nearest cities:
(Note: Based on data for all years, including only cities with at least 500 fire incidents)
| Valley Park: | 6 minutes |
| Manchester: | 5 minutes |
| Fenton: | 6 minutes |
| Ballwin: | 5 minutes |
| Kirkwood: | 5 minutes |
| Sunset Hills: | 5 minutes |
| Ellisville: | 4 minutes |
| Crestwood: | 4 minutes |
| High Ridge: | 6 minutes |
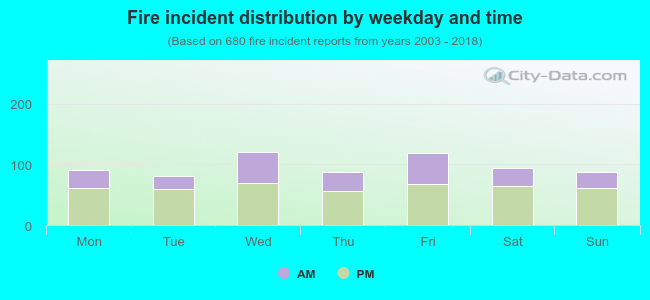 35.1% incidents where reported in the morning and 64.9% in the evening. The most fires (17.8%) took place on Wednesday, and the least (11.9%) on Tuesday.
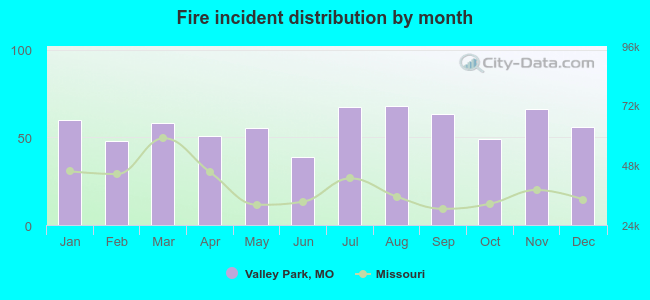 Based on the 680 fires from years 2003 - 2018 most fires (10.0%) took place during August, and the least (5.7%) in June.
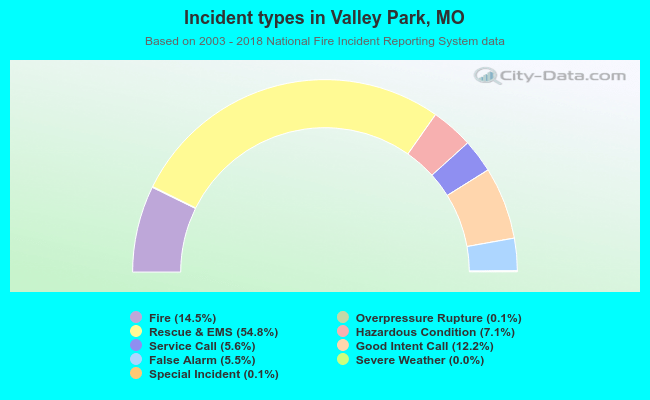 Out of all 4,681 cases reported during the years 2003 - 2018, the most belonged to the categories: Rescue & EMS (54.8%), Fire (14.5%), and Good Intent Call (12.2%).
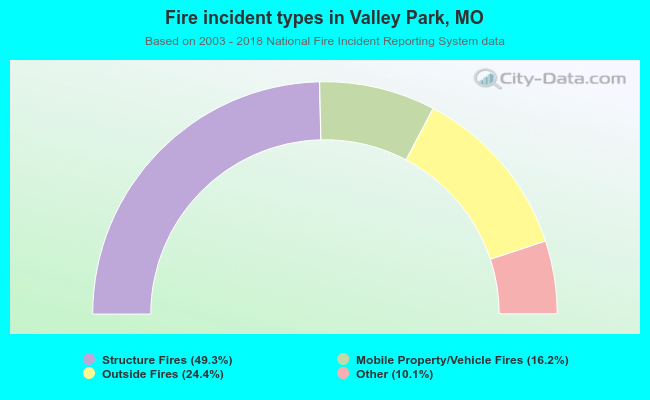 When looking into fire subcategories, the most incidents belonged to: Structure Fires (49.3%), and Outside Fires (24.4%).