Des Peres: Fire Incidents, Missouri (MO)
Where are fire incidents reported in Des Peres, MO
Something went wrong! Please refresh the page.
|
| |||||||||||||||||||||||||||||||||||||||||||||||||||||||||||||||||||||||||||||||||||||||||||||||||||||||||||||
2002 - 2018 National Fire Incident Reporting System (NFIRS) incidents
- Incident types reported to NFIRS in Des Peres, MO
- 1,24034.5%Rescue & EMS
- 92325.7%Good Intent Call
- 47513.2%False Alarm
- 37810.5%Fire
- 3469.6%Hazardous Condition
- 2115.9%Service Call
- 110.3%Overpressure Rupture
- 60.2%Special Incident
- Fire incident types reported to NFIRS in Des Peres, MO
- 17847.1%Structure Fires
- 8221.7%Mobile Property/Vehicle Fires
- 6015.9%Outside Fires
- 5815.3%Other
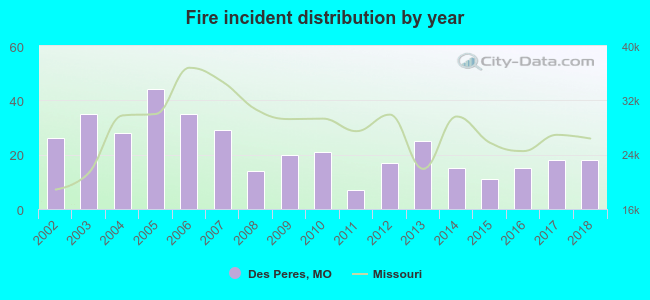 Based on the data from the years 2002 - 2018 the average number of fires per year is 22. The highest number of fires - 44 took place in 2005, and the least - 7 in 2011. The data has a declining trend.
The average number of yearly fire incidents per 10k residents in Des Peres, MO compared to nearest cities:
(Note: Based on data for the last 3 years, including only cities with population 5,000 and above)
| Des Peres: | 19.9 |
| Kirkwood: | 26.6 |
| Town and Country: | 26.1 |
| Manchester: | 15.8 |
| Glendale: | 11.3 |
| Valley Park: | 33.4 |
| Ladue: | 48.2 |
| Crestwood: | 22.6 |
| Sunset Hills: | 39.5 |
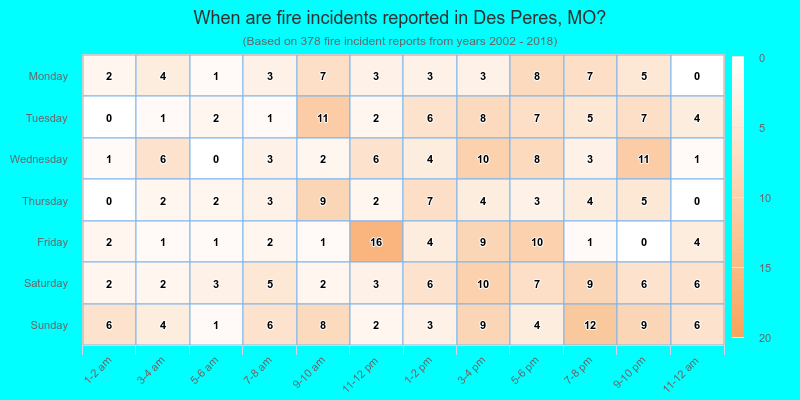
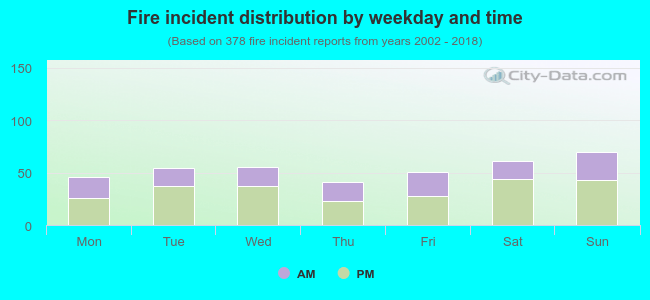 37.0% incidents where reported in the morning and 63.0% in the evening. The most fires (18.5%) took place on Sunday, and the least (10.8%) on Thursday.
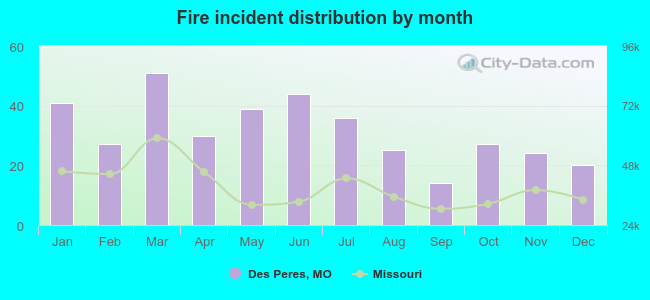 Based on the 378 fire incident reports from years 2002 - 2018 most fires (13.5%) took place during March, and the least (3.7%) in September.
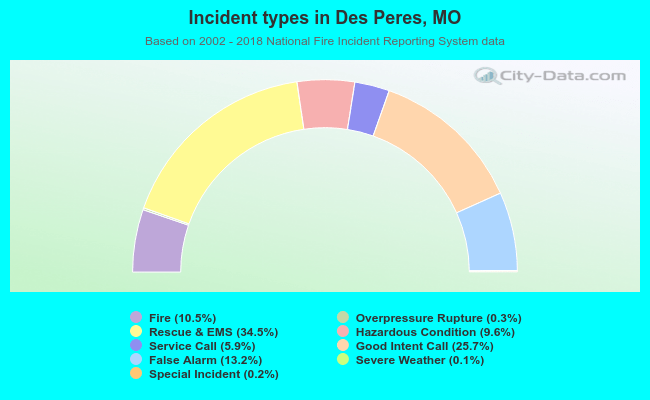 Out of all 3,592 cases reported during the years 2002 - 2018, the most belonged to the categories: Rescue & EMS (34.5%), Good Intent Call (25.7%), and False Alarm (13.2%).
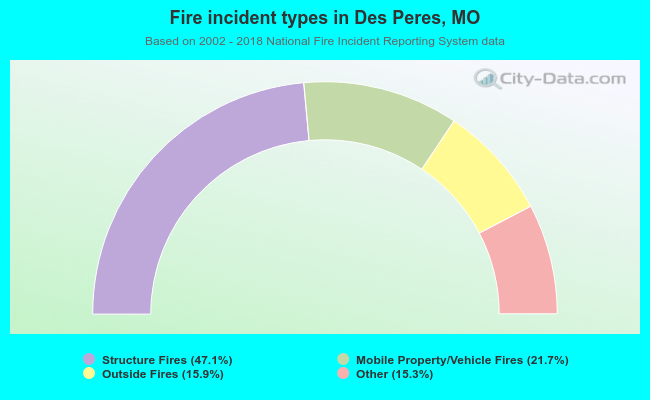 When looking into fire subcategories, the most reports belonged to: Structure Fires (47.1%), and Mobile Property/Vehicle Fires (21.7%).