Star: Fire Incidents, Idaho (ID)
Where are fire incidents reported in Star, ID
Something went wrong! Please refresh the page.
|
| |||||||||||||||||||||||||||||||||||||||||||||||||||||||||||||||||||||||||||||||||||||||||||||||||||||||||||||
2002 - 2018 National Fire Incident Reporting System (NFIRS) incidents
- Incident types reported to NFIRS in Star, ID
- 1,34234.7%Rescue & EMS
- 1,11028.7%Fire
- 53813.9%Service Call
- 45511.7%Good Intent Call
- 2436.3%Hazardous Condition
- 1814.7%False Alarm
- Fire incident types reported to NFIRS in Star, ID
- 72865.6%Outside Fires
- 26624.0%Structure Fires
- 726.5%Mobile Property/Vehicle Fires
- 444.0%Other
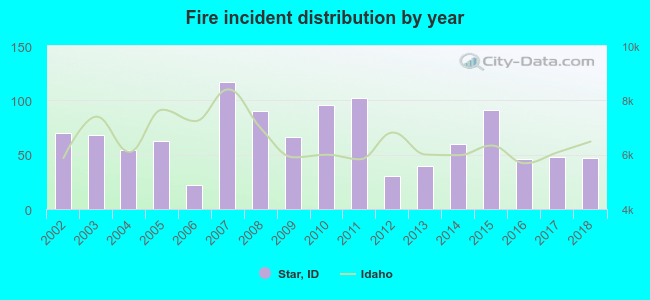 Based on the data from the years 2002 - 2018 the average number of fire incidents per year is 65. The highest number of reported fire incidents - 117 took place in 2007, and the least - 22 in 2006. The data has a dropping trend.
The average number of yearly fire incidents per 10k residents in Star, ID compared to nearest cities:
(Note: Based on data for the last 3 years, including only cities with population 5,000 and above)
| Star: | 64.4 |
| Middleton: | 77.9 |
| Meridian: | 25.0 |
| Eagle: | 41.0 |
| Nampa: | 29.8 |
| Caldwell: | 65.6 |
| Garden City: | 28.3 |
| Emmett: | 182.4 |
| Boise: | 24.6 |
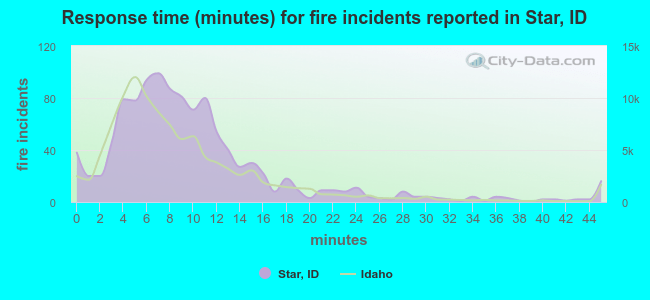 The median response time based on all reported fire incidents is 8 minutes. This is comparable to the state median value.
The median response time in Star, ID compared to nearest cities:
(Note: Based on data for all years, including only cities with at least 500 fire incidents)
| Star: | 8 minutes |
| Middleton: | 10 minutes |
| Meridian: | 6 minutes |
| Eagle: | 7 minutes |
| Nampa: | 6 minutes |
| Caldwell: | 8 minutes |
| Garden City: | 5 minutes |
| Emmett: | 7 minutes |
| Boise: | 5 minutes |
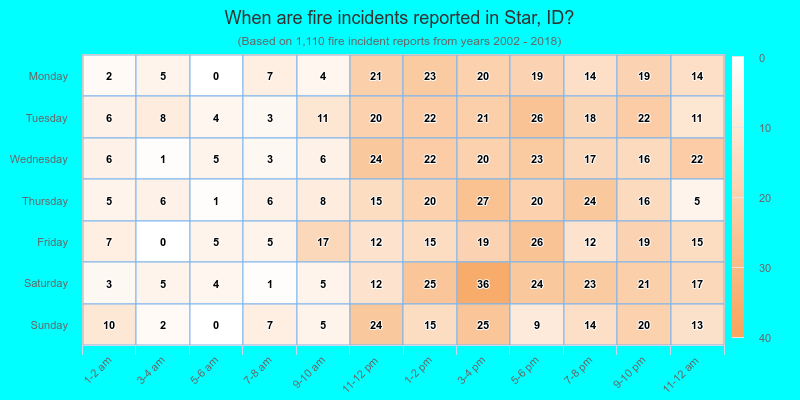
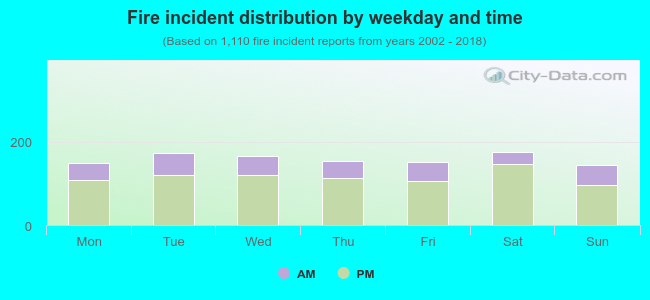 27.1% incidents where reported in the morning and 72.9% in the evening. The most fires (15.9%) took place on Saturday, and the least (13.0%) on Sunday.
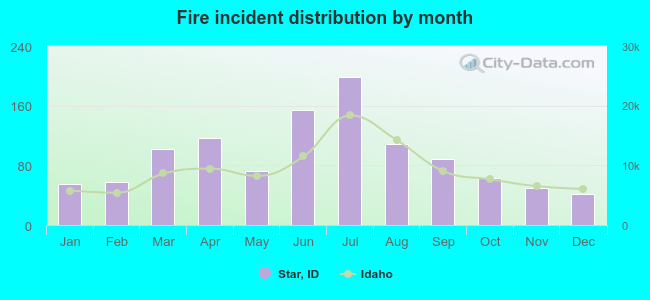 Based on the 1,110 reports from years 2002 - 2018 most fires (17.9%) took place during July, and the least (3.8%) in December.
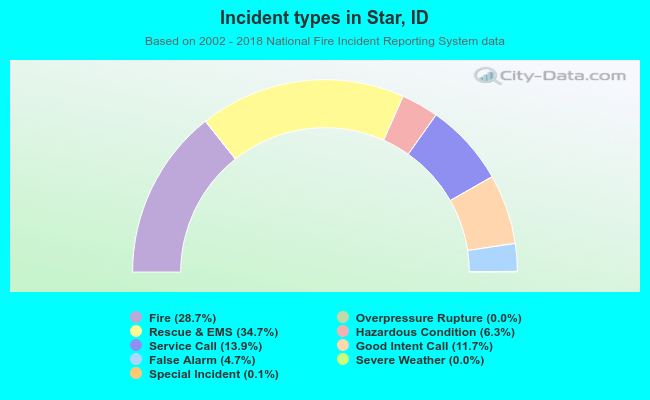 Out of all 3,873 cases reported during the years 2002 - 2018, the most belonged to the categories: Rescue & EMS (34.7%), Fire (28.7%), and Service Call (13.9%).
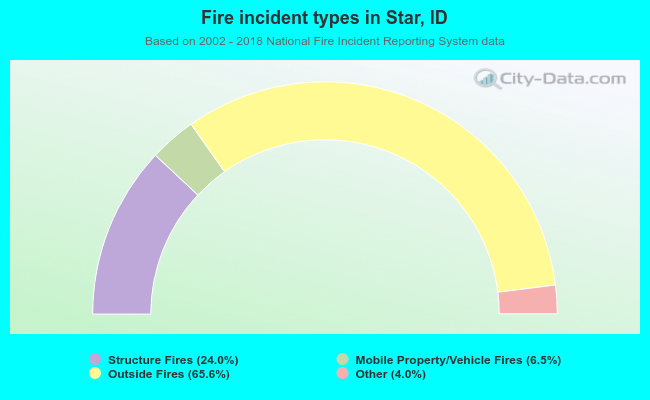 When looking into fire subcategories, the most reports belonged to: Outside Fires (65.6%), and Structure Fires (24.0%).