Eagle: Fire Incidents, Idaho (ID)
Where are fire incidents reported in Eagle, ID
Something went wrong! Please refresh the page.
| Fire incidents reported | |
|---|---|
| Sreet name | Count |
| STATE ST | 150 |
| EAGLE RD | 136 |
| BEACON LIGHT RD | 126 |
| HIGHWAY 16 | 68 |
| HIGHWAY 55 HWY | 62 |
| HORSESHOE BEND RD | 58 |
| FLOATING FEATHER RD | 52 |
| LINDER RD | 48 |
| WILLOW CREEK RD | 46 |
| HATCHERY RD | 40 |
| HWY 16 | 40 |
| CHINDEN BLVD | 34 |
| HILL RD | 32 |
| STATE | 32 |
| PARK LN | 28 |
| ARTESIAN RD | 24 |
| BEACONLIGHT RD | 24 |
| HWY 55 | 24 |
| BROOKSIDE LN | 22 |
| HIGHWAY 44 | 22 |
| BALLANTYNE LANE | 20 |
| CHINDEN BL | 18 |
| EDGEWOOD LN | 18 |
| PARK LANE | 18 |
| STILLWELL DR | 18 |
| MACE RD | 16 |
| RUSH RD | 16 |
| SADDLEMAN PL | 16 |
| ARNOLD RD | 14 |
| BROOKSIDE LANE | 14 |
| Other | 435 |
2002 - 2018 National Fire Incident Reporting System (NFIRS) incidents
- Incident types reported to NFIRS in Eagle, ID
- 4,21344.0%Rescue & EMS
- 1,67117.5%Fire
- 1,28713.4%Good Intent Call
- 1,14211.9%Service Call
- 6466.7%False Alarm
- 5726.0%Hazardous Condition
- 270.3%Overpressure Rupture
- Fire incident types reported to NFIRS in Eagle, ID
- 89053.3%Outside Fires
- 54732.7%Structure Fires
- 1378.2%Mobile Property/Vehicle Fires
- 975.8%Other
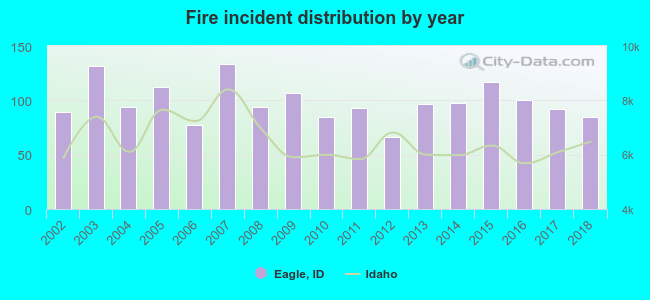 According to the data from the years 2002 - 2018 the average number of fire incidents per year is 98. The highest number of reported fires - 133 took place in 2007, and the least - 66 in 2012. The data has a declining trend.
The average number of yearly fire incidents per 10k residents in Eagle, ID compared to nearest cities:
(Note: Based on data for the last 3 years, including only cities with population 5,000 and above)
| Eagle: | 41.0 |
| Garden City: | 28.3 |
| Meridian: | 25.0 |
| Star: | 64.4 |
| Boise: | 24.6 |
| Nampa: | 29.8 |
| Middleton: | 77.9 |
| Kuna: | 53.9 |
| Emmett: | 182.4 |
 The median response time based on all reported fire incidents is 7 minutes. This is about the same as the state median value.
The median response time in Eagle, ID compared to nearest cities:
(Note: Based on data for all years, including only cities with at least 500 fire incidents)
| Eagle: | 7 minutes |
| Garden City: | 5 minutes |
| Meridian: | 6 minutes |
| Star: | 8 minutes |
| Boise: | 5 minutes |
| Nampa: | 6 minutes |
| Middleton: | 10 minutes |
| Kuna: | 10 minutes |
| Emmett: | 7 minutes |
 According to the reports from the years 2002 - 2018 the average number of fire-related yearly deaths is 0. The highest number of deaths - 4 took place in 2007, and the lowest - 0 in 2002. The data has a constant trend.
 According to the reports from the years 2002 - 2018 the average number of fire-related yearly casualties is 0. The highest number of reported injuries - 1 took place in 2005, and the lowest - 0 in 2002. The data has a constant trend.
The average number of injuries per 1,000 fire incidents is 2. This indicator was the highest - 11 in 2011, and the lowest 0 in 2002. The trend for injuries per 1,000 incidents is constant. Compared to the state value the number of injuries per 1,000 incidents is much lower.
According to the reports from the years 2002 - 2018 the average number of fire-related yearly casualties is 0. The highest number of reported injuries - 1 took place in 2005, and the lowest - 0 in 2002. The data has a constant trend.
The average number of injuries per 1,000 fire incidents is 2. This indicator was the highest - 11 in 2011, and the lowest 0 in 2002. The trend for injuries per 1,000 incidents is constant. Compared to the state value the number of injuries per 1,000 incidents is much lower.
 29.4% incidents where reported in the morning and 70.6% in the evening. The most fires (16.7%) took place on Saturday, and the least (13.0%) on Sunday.
 According to the 1,671 fire incident reports from years 2002 - 2018 most fires (17.2%) took place during July, and the least (4.4%) in February.
 Out of all 9,573 cases reported during the years 2002 - 2018, the most belonged to the categories: Rescue & EMS (44.0%), Fire (17.5%), and Good Intent Call (13.4%).
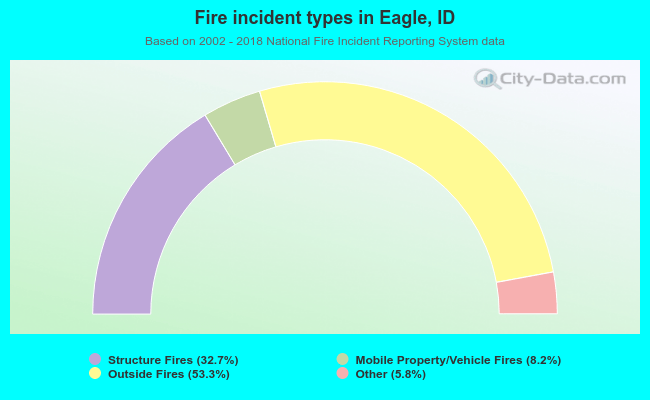 When looking into fire subcategories, the most incidents belonged to: Outside Fires (53.3%), and Structure Fires (32.7%).