Meridian: Fire Incidents, Idaho (ID)
Where are fire incidents reported in Meridian, ID
Something went wrong! Please refresh the page.
| Fire incidents reported | |
|---|---|
| Sreet name | Count |
| EAGLE RD | 306 |
| LINDER RD | 224 |
| FRANKLIN RD | 214 |
| BLACK CAT RD | 196 |
| AMITY RD | 180 |
| MERIDIAN RD | 174 |
| TEN MILE RD | 166 |
| LOCUST GROVE RD | 156 |
| FAIRVIEW AV | 152 |
| OVERLAND RD | 140 |
| CHINDEN BL | 122 |
| PINE AV | 122 |
| I 84 | 108 |
| CHERRY LN | 106 |
| USTICK RD | 100 |
| VICTORY RD | 94 |
| MCMILLAN RD | 78 |
| MCDERMOTT RD | 60 |
| LAKE HAZEL RD | 48 |
| FAIRVIEW AVE | 44 |
| MAIN ST | 34 |
| BROADWAY AV | 30 |
| CENTRAL DR | 30 |
| CLOVERDALE RD | 28 |
| CHINDEN BLVD | 26 |
| DUCK ALLEY RD | 26 |
| LANARK ST | 26 |
| PENNWOOD ST | 26 |
| BLACKCAT RD | 24 |
| STAR RD | 22 |
| Other | 434 |
2002 - 2018 National Fire Incident Reporting System (NFIRS) incidents
- Incident types reported to NFIRS in Meridian, ID
- 17,31352.3%Rescue & EMS
- 5,29016.0%Good Intent Call
- 3,49610.6%Fire
- 3,39010.2%Service Call
- 2,0846.3%False Alarm
- 1,4564.4%Hazardous Condition
- Fire incident types reported to NFIRS in Meridian, ID
- 1,81551.9%Outside Fires
- 1,04629.9%Structure Fires
- 55315.8%Mobile Property/Vehicle Fires
- 822.3%Other
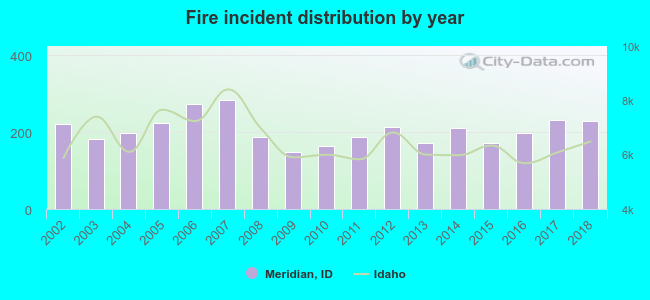 Based on the data from the years 2002 - 2018 the average number of fires per year is 206. The highest number of fire incidents - 283 took place in 2007, and the least - 149 in 2009. The data has an increasing trend.
The average number of yearly fire incidents per 10k residents in Meridian, ID compared to nearest cities:
(Note: Based on data for the last 3 years, including only cities with population 5,000 and above)
| Meridian: | 25.0 |
| Eagle: | 41.0 |
| Garden City: | 28.3 |
| Star: | 64.4 |
| Boise: | 24.6 |
| Kuna: | 53.9 |
| Nampa: | 29.8 |
| Middleton: | 77.9 |
| Caldwell: | 65.6 |
 The median response time based on all reported fire incidents is 6 minutes. This is close to the Idaho median value.
The median response time in Meridian, ID compared to nearest cities:
(Note: Based on data for all years, including only cities with at least 500 fire incidents)
| Meridian: | 6 minutes |
| Eagle: | 7 minutes |
| Garden City: | 5 minutes |
| Star: | 8 minutes |
| Boise: | 5 minutes |
| Kuna: | 10 minutes |
| Nampa: | 6 minutes |
| Middleton: | 10 minutes |
| Caldwell: | 8 minutes |
 Based on the reports from the years 2002 - 2018 the average number of fire-related yearly deaths is 0. The highest number of reported deaths - 3 took place in 2017, and the lowest - 0 in 2003. The data has a declining trend.
The average number of deaths per 1,000 fire incidents is 2. This indicator was the highest - 13 in 2017, and the lowest 0 in 2003. The trend for fatalities per 1,000 fire incidents is decreasing. Compared to the state value the number of fatalities per 1,000 fires is lower.
Based on the reports from the years 2002 - 2018 the average number of fire-related yearly deaths is 0. The highest number of reported deaths - 3 took place in 2017, and the lowest - 0 in 2003. The data has a declining trend.
The average number of deaths per 1,000 fire incidents is 2. This indicator was the highest - 13 in 2017, and the lowest 0 in 2003. The trend for fatalities per 1,000 fire incidents is decreasing. Compared to the state value the number of fatalities per 1,000 fires is lower.
 According to the reports from the years 2002 - 2018 the average number of fire-related yearly casualties is 2. The highest number of reported casualties - 5 took place in 2004, and the lowest - 0 in 2008. The data has a dropping trend.
The average number of injuries per 1,000 fire incidents is 10. This indicator was the highest - 31 in 2010, and the lowest 0 in 2008. The trend for casualties per 1,000 incidents is dropping. Compared to the Idaho value the number of injuries per 1,000 incidents is about the same.
According to the reports from the years 2002 - 2018 the average number of fire-related yearly casualties is 2. The highest number of reported casualties - 5 took place in 2004, and the lowest - 0 in 2008. The data has a dropping trend.
The average number of injuries per 1,000 fire incidents is 10. This indicator was the highest - 31 in 2010, and the lowest 0 in 2008. The trend for casualties per 1,000 incidents is dropping. Compared to the Idaho value the number of injuries per 1,000 incidents is about the same.
 27.5% incidents where reported in the morning and 72.5% in the evening. The most fires (15.5%) took place on Monday, and the least (11.7%) on Sunday.
 Based on the 3,496 reports from years 2002 - 2018 most fires (16.4%) took place during July, and the least (4.8%) in February.
 Out of all 33,080 cases reported during the years 2002 - 2018, the most belonged to the categories: Rescue & EMS (52.3%), Good Intent Call (16.0%), and Fire (10.6%).
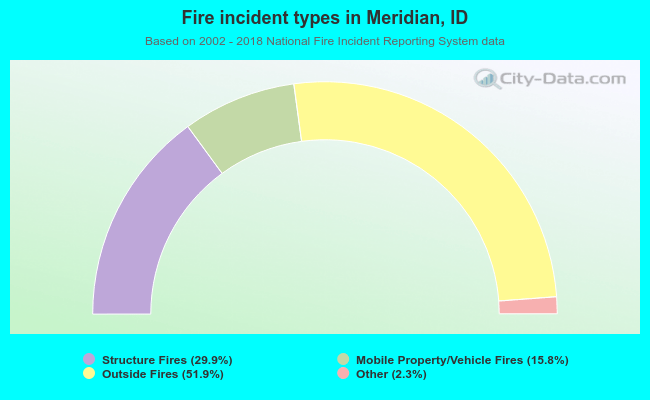 When looking into fire subcategories, the most reports belonged to: Outside Fires (51.9%), and Structure Fires (29.9%).