Scranton: Fire Incidents, Pennsylvania (PA)
Where are fire incidents reported in Scranton, PA
Something went wrong! Please refresh the page.
| Fire incidents reported | |
|---|---|
| Sreet name | Count |
| SPRUCE ST | 178 |
| MULBERRY ST | 144 |
| MAIN AV | 124 |
| ADAMS AV | 114 |
| MAIN AVE | 106 |
| WASHINGTON AV | 104 |
| ADAMS AVE | 102 |
| WASHINGTON AVE | 84 |
| LUZERNE ST | 80 |
| KEYSER AV | 72 |
| OLIVE ST | 72 |
| MARKET ST | 68 |
| JACKSON ST | 64 |
| LINDEN ST | 64 |
| PINE ST | 62 |
| CAPOUSE AV | 58 |
| WYOMING AV | 56 |
| CEDAR AV | 52 |
| CEDAR AVE | 52 |
| CLAY AV | 50 |
| KEYSER AVE | 50 |
| SMALLCOMBE DR | 50 |
| ELM ST | 48 |
| VINE ST | 46 |
| DOROTHY ST | 44 |
| WASHBURN ST | 44 |
| WYOMING AVE | 44 |
| I-81 | 42 |
| PITTSTON AVE | 42 |
| FERDINAND ST | 40 |
| Other | 919 |
2006 - 2018 National Fire Incident Reporting System (NFIRS) incidents
- Incident types reported to NFIRS in Scranton, PA
- 3,79132.0%Hazardous Condition
- 3,07526.0%Fire
- 1,61413.6%Rescue & EMS
- 1,48212.5%False Alarm
- 1,1249.5%Service Call
- 5134.3%Good Intent Call
- 1941.6%Special Incident
- 300.3%Overpressure Rupture
- 250.2%Severe Weather
- Fire incident types reported to NFIRS in Scranton, PA
- 1,69255.0%Structure Fires
- 94130.6%Outside Fires
- 41913.6%Mobile Property/Vehicle Fires
- 230.7%Other
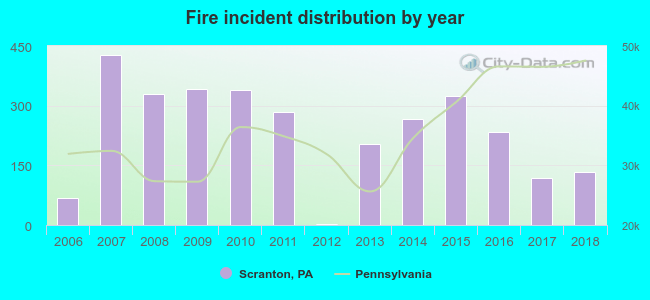 According to the data from the years 2006 - 2018 the average number of fire incidents per year is 237. The highest number of fires - 427 took place in 2007, and the least - 2 in 2012. The data has an increasing trend.
The average number of yearly fire incidents per 10k residents in Scranton, PA compared to nearest cities:
(Note: Based on data for the last 3 years, including only cities with population 5,000 and above)
| Scranton: | 21.6 |
| Dunmore: | 16.9 |
| Taylor: | 4.9 |
| Moosic: | 42.2 |
| Dickson City: | 25.5 |
| Old Forge: | 33.3 |
| Olyphant: | 78.7 |
| Clarks Summit: | 28.3 |
| Blakely: | 13.9 |
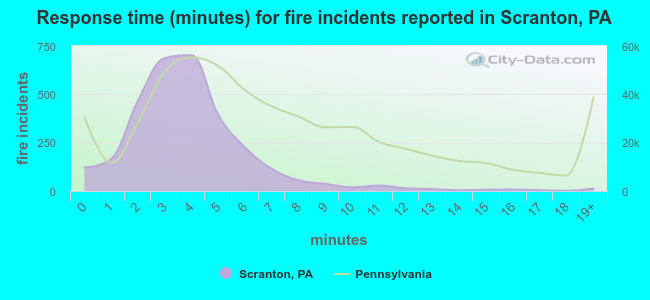 The median response time based on all reported fire incidents is 4 minutes. This is lower than the state median value.
The median response time in Scranton, PA compared to nearest cities:
(Note: Based on data for all years, including only cities with at least 500 fire incidents)
| Scranton: | 4 minutes |
| Kingston: | 3 minutes |
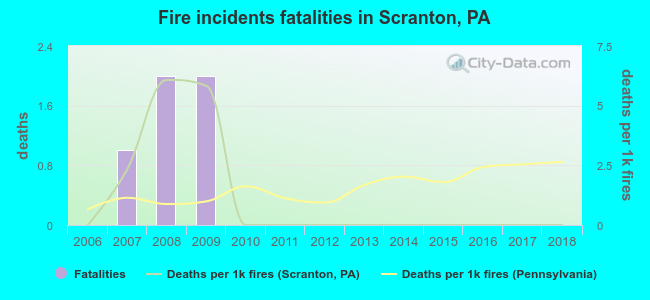 Based on the data from the years 2006 - 2018 the average number of fire-related fatalities per year is 0. The highest number of deaths - 2 took place in 2008, and the lowest - 0 in 2006. The data has a constant trend.
The average number of fatalities per 1,000 fires is 1. This indicator was the highest - 6 in 2008, and the lowest 0 in 2006. The trend for deaths per 1,000 fires is constant. Compared to the state value the number of fatalities per 1,000 fires is about the same.
Based on the data from the years 2006 - 2018 the average number of fire-related fatalities per year is 0. The highest number of deaths - 2 took place in 2008, and the lowest - 0 in 2006. The data has a constant trend.
The average number of fatalities per 1,000 fires is 1. This indicator was the highest - 6 in 2008, and the lowest 0 in 2006. The trend for deaths per 1,000 fires is constant. Compared to the state value the number of fatalities per 1,000 fires is about the same.Deaths per 1,000 incidents in Scranton, PA compared to nearest cities:
(Note: Based on data for all years, including only cities with at least 2,500 fire incidents)
| Scranton: | 1.6 |
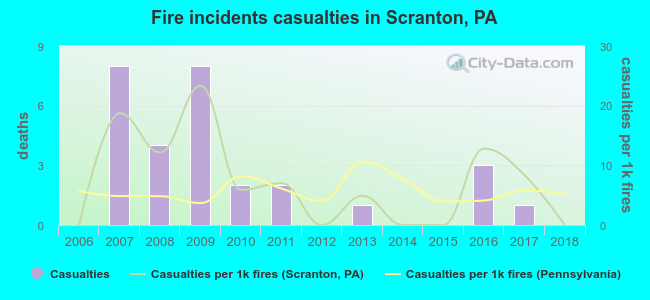 According to the data from the years 2006 - 2018 the average number of fire-related yearly casualties is 2. The highest number of casualties - 8 took place in 2007, and the lowest - 0 in 2006. The data has a constant trend.
The average number of casualties per 1,000 fire incidents is 7. This indicator was the highest - 23 in 2009, and the lowest 0 in 2006. The trend for casualties per 1,000 fire incidents is rising. Compared to the Pennsylvania value the number of injuries per 1,000 incidents is higher.
According to the data from the years 2006 - 2018 the average number of fire-related yearly casualties is 2. The highest number of casualties - 8 took place in 2007, and the lowest - 0 in 2006. The data has a constant trend.
The average number of casualties per 1,000 fire incidents is 7. This indicator was the highest - 23 in 2009, and the lowest 0 in 2006. The trend for casualties per 1,000 fire incidents is rising. Compared to the Pennsylvania value the number of injuries per 1,000 incidents is higher.Casualties per 1,000 incidents in Scranton, PA compared to nearest cities:
(Note: Based on data for all years, including only cities with at least 500 fire incidents)
| Scranton: | 9.4 |
| Kingston: | 35.5 |
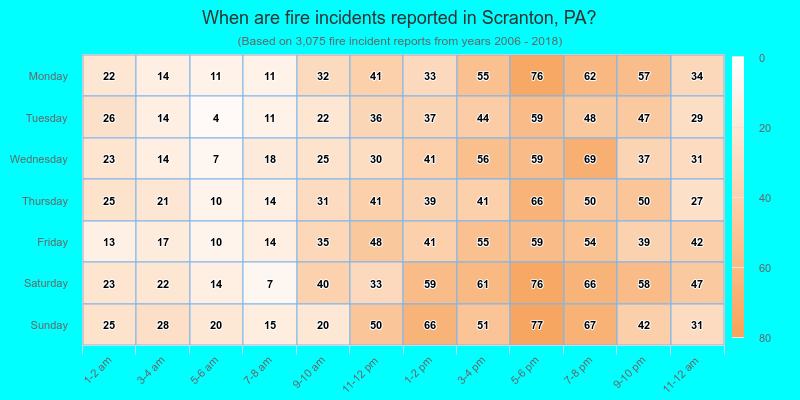
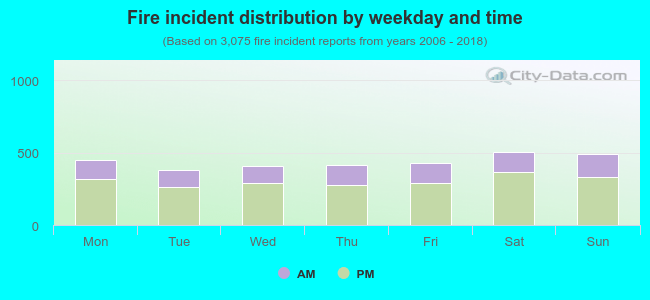 30.5% incidents where reported in the morning and 69.5% in the evening. The most fires (16.5%) took place on Saturday, and the least (12.3%) on Tuesday.
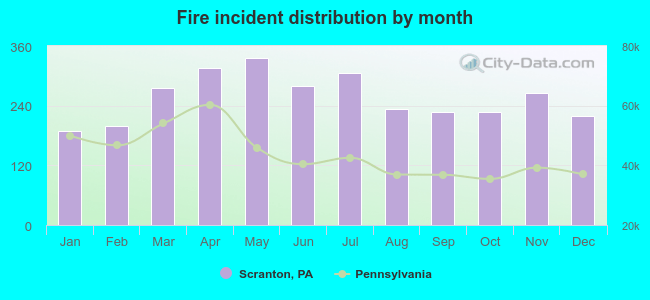 Based on the 3,075 incident reports from years 2006 - 2018 most fires (10.9%) took place during May, and the least (6.2%) in January.
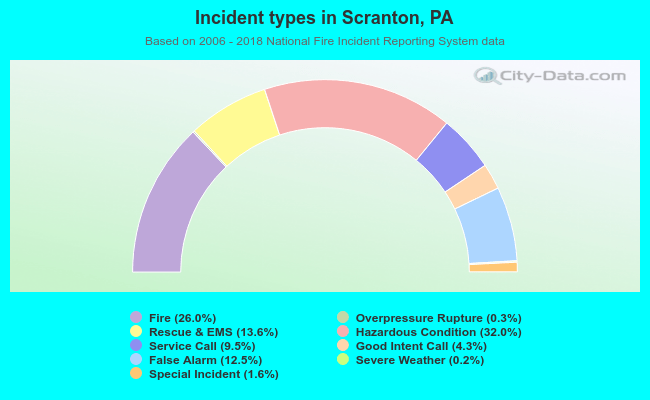 Out of all 11,848 cases reported during the years 2006 - 2018, the most belonged to the categories: Hazardous Condition (32.0%), Fire (26.0%), and Rescue & EMS (13.6%).
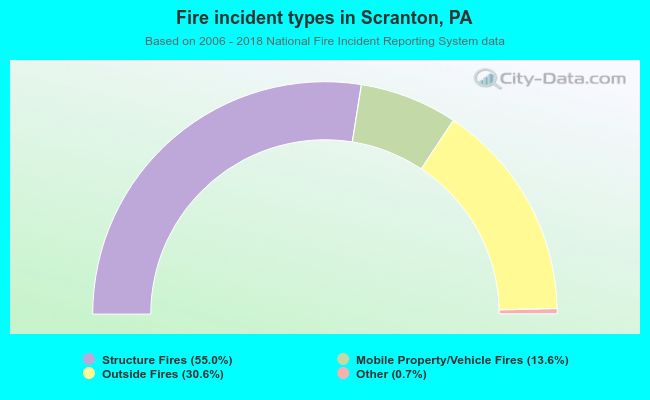 When looking into fire subcategories, the most incidents belonged to: Structure Fires (55.0%), and Outside Fires (30.6%).