Kingston: Fire Incidents, Pennsylvania (PA)
Where are fire incidents reported in Kingston, PA
Something went wrong! Please refresh the page.
| Fire incidents reported | |
|---|---|
| Sreet name | Count |
| MARKET ST | 140 |
| WYOMING AVE | 134 |
| WEST MARKET STREET | 102 |
| ZERBY AVE | 64 |
| WYOMING AVE. | 58 |
| MARKET ST. | 44 |
| WYOMING AVENUE | 42 |
| ZERBY AVENUE | 40 |
| SPRAGUE AVE | 36 |
| 1ST AVE | 28 |
| PAGE AVE | 22 |
| 3RD AVE | 20 |
| BUTLER ST | 20 |
| CHURCH ST | 20 |
| NORTHAMPTON ST | 20 |
| RUTTER AVE | 18 |
| SCHUYLER AVE. | 18 |
| 2ND AVE | 16 |
| 1ST AVE. | 14 |
| CHURCH ST. | 14 |
| DORRANCE ST | 14 |
| ATHERTON AVE | 12 |
| DAWES AVE | 12 |
| FIRST AVENUE | 12 |
| MAIN STREET | 12 |
| MAPLE AVE | 12 |
| NORTH SPRAGUE AVENUE | 12 |
| PIERCE ST. | 12 |
| PRINGLE ST | 12 |
| SPRAGUE AVE. | 12 |
2004 - 2018 National Fire Incident Reporting System (NFIRS) incidents
- Incident types reported to NFIRS in Kingston, PA
- 8,01265.7%Rescue & EMS
- 1,1719.6%Hazardous Condition
- 8456.9%Fire
- 7766.4%False Alarm
- 7566.2%Service Call
- 6045.0%Good Intent Call
- 320.3%Severe Weather
- Fire incident types reported to NFIRS in Kingston, PA
- 66778.9%Structure Fires
- 12314.6%Outside Fires
- 495.8%Mobile Property/Vehicle Fires
- 60.7%Other
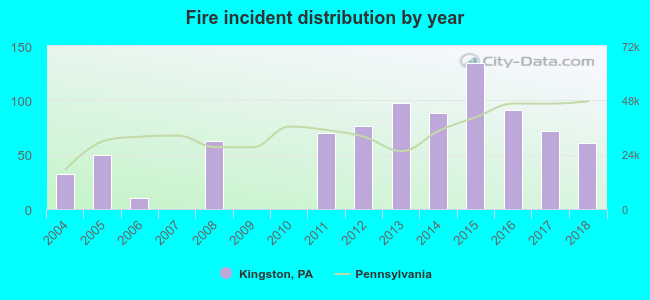 According to the data from the years 2004 - 2018 the average number of fires per year is 56. The highest number of fires - 134 took place in 2015, and the least - 0 in 2007. The data has an increasing trend.
The average number of yearly fire incidents per 10k residents in Kingston, PA compared to nearest cities:
(Note: Based on data for the last 3 years, including only cities with population 5,000 and above)
| Kingston: | 57.5 |
| Swoyersville: | 4.7 |
| Plymouth: | 23.3 |
| Exeter: | 58.3 |
| Pittston: | 52.9 |
| Nanticoke: | 36.6 |
| Mountain Top: | 38.5 |
| Old Forge: | 33.3 |
| Moosic: | 42.2 |
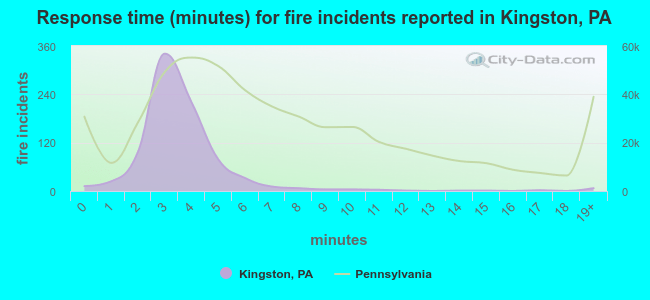 The median response time based on all reported fire incidents is 3 minutes. This is much lower than the Pennsylvania median value.
The median response time in Kingston, PA compared to nearest cities:
(Note: Based on data for all years, including only cities with at least 500 fire incidents)
| Kingston: | 3 minutes |
| Scranton: | 4 minutes |
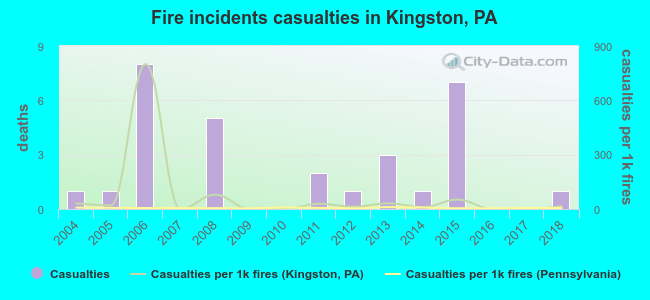 According to the data from the years 2004 - 2018 the average number of fire-related yearly casualties is 2. The highest number of reported casualties - 8 took place in 2006, and the lowest - 0 in 2007. The data has a constant trend.
The average number of injuries per 1,000 fire incidents is 72. This indicator was the highest - 800 in 2006, and the lowest 0 in 2007. The trend for injuries per 1,000 incidents is dropping. Compared to the Pennsylvania value the number of injuries per 1,000 fire incidents is much higher.
According to the data from the years 2004 - 2018 the average number of fire-related yearly casualties is 2. The highest number of reported casualties - 8 took place in 2006, and the lowest - 0 in 2007. The data has a constant trend.
The average number of injuries per 1,000 fire incidents is 72. This indicator was the highest - 800 in 2006, and the lowest 0 in 2007. The trend for injuries per 1,000 incidents is dropping. Compared to the Pennsylvania value the number of injuries per 1,000 fire incidents is much higher.Casualties per 1,000 incidents in Kingston, PA compared to nearest cities:
(Note: Based on data for all years, including only cities with at least 500 fire incidents)
| Kingston: | 35.5 |
| Scranton: | 9.4 |
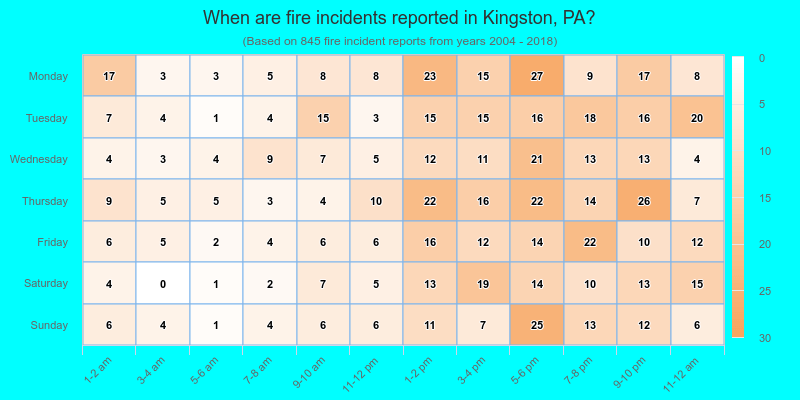
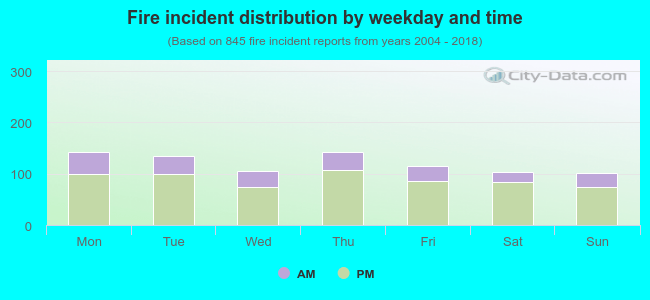 26.2% incidents where reported in the morning and 73.8% in the evening. The most fires (16.9%) took place on Monday, and the least (12.0%) on Sunday.
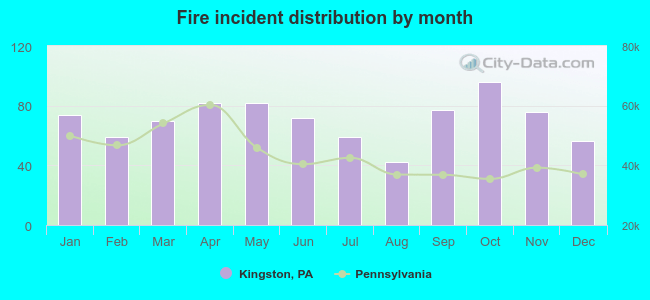 Based on the 845 fire incidents from years 2004 - 2018 most fires (11.4%) took place during October, and the least (5.0%) in August.
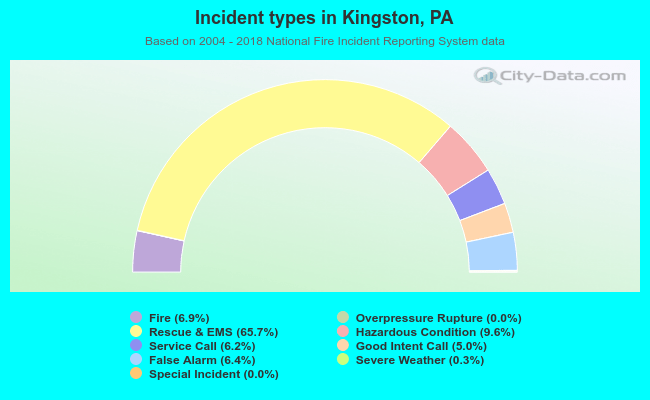 Out of all 12,201 cases reported during the years 2004 - 2018, the most belonged to the categories: Rescue & EMS (65.7%), Hazardous Condition (9.6%), and Fire (6.9%).
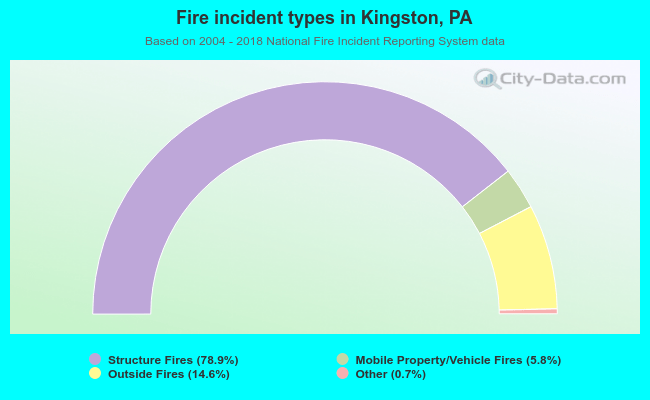 When looking into fire subcategories, the most incidents belonged to: Structure Fires (78.9%), and Outside Fires (14.6%).