Dunmore: Fire Incidents, Pennsylvania (PA)
Where are fire incidents reported in Dunmore, PA
Something went wrong! Please refresh the page.
|
| |||||||||||||||||||||||||||||||||||||||||||||||||||||||||||||||||||||||||||||||||||||||||||||||||||||||||||||
2003 - 2018 National Fire Incident Reporting System (NFIRS) incidents
- Incident types reported to NFIRS in Dunmore, PA
- 32928.3%Rescue & EMS
- 25622.0%Fire
- 21218.2%Hazardous Condition
- 17214.8%False Alarm
- 1069.1%Service Call
- 524.5%Good Intent Call
- 262.2%Special Incident
- 50.4%Overpressure Rupture
- 50.4%Severe Weather
- Fire incident types reported to NFIRS in Dunmore, PA
- 15660.9%Structure Fires
- 4618.0%Mobile Property/Vehicle Fires
- 3312.9%Outside Fires
- 218.2%Other
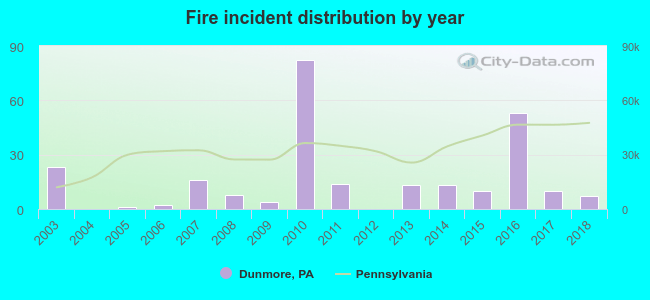 According to the data from the years 2003 - 2018 the average number of fires per year is 16. The highest number of reported fire incidents - 82 took place in 2010, and the least - 0 in 2004. The data has a dropping trend.
The average number of yearly fire incidents per 10k residents in Dunmore, PA compared to nearest cities:
(Note: Based on data for the last 3 years, including only cities with population 5,000 and above)
| Dunmore: | 16.9 |
| Scranton: | 21.6 |
| Dickson City: | 25.5 |
| Olyphant: | 78.7 |
| Blakely: | 13.9 |
| Taylor: | 4.9 |
| Moosic: | 42.2 |
| Archbald: | 29.7 |
| Clarks Summit: | 28.3 |
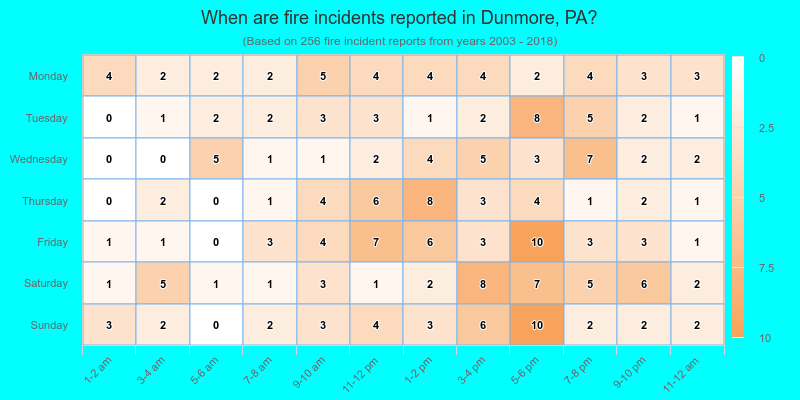
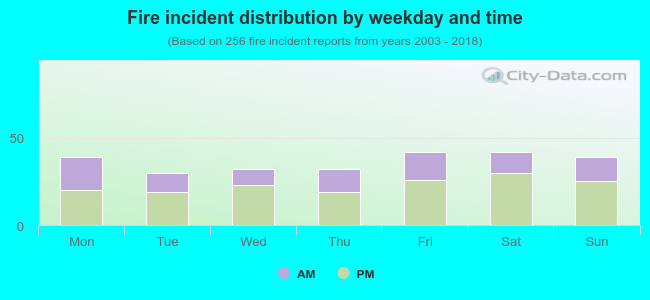 36.7% incidents where reported in the morning and 63.3% in the evening. The most fires (16.4%) took place on Friday, and the least (11.7%) on Tuesday.
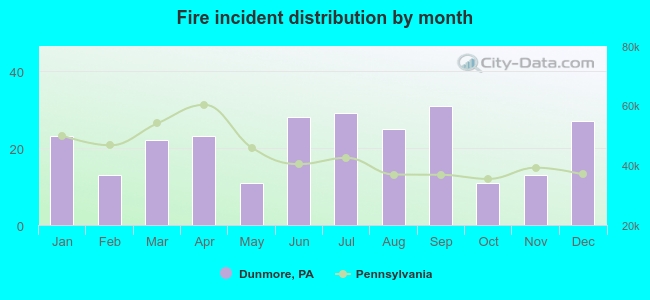 According to the 256 fire incidents from years 2003 - 2018 most fires (12.1%) took place during September, and the least (4.3%) in May.
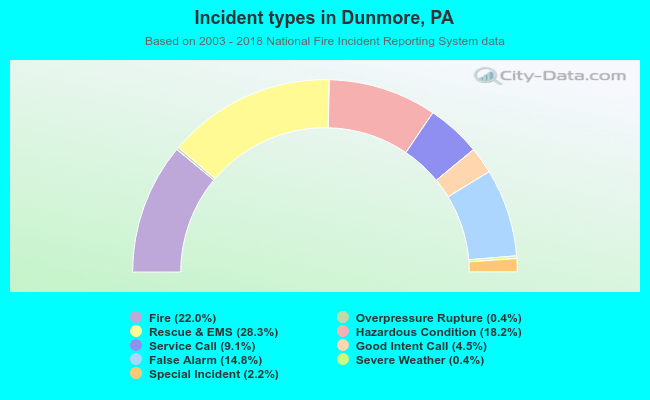 Out of all 1,163 cases reported during the years 2003 - 2018, the most belonged to the categories: Rescue & EMS (28.3%), Fire (22.0%), and Hazardous Condition (18.2%).
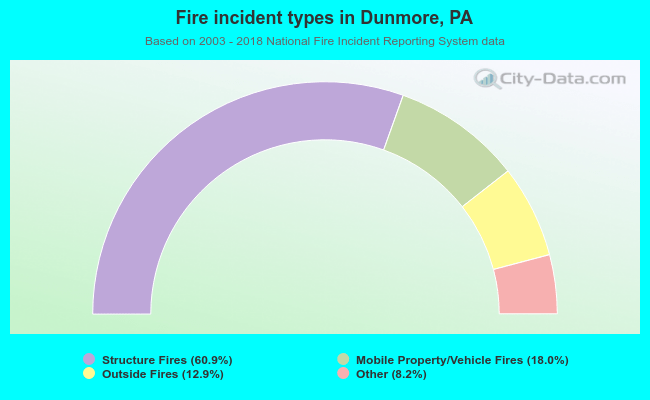 When looking into fire subcategories, the most reports belonged to: Structure Fires (60.9%), and Mobile Property/Vehicle Fires (18.0%).