Rock Falls: Fire Incidents, Illinois (IL)
Where are fire incidents reported in Rock Falls, IL
Something went wrong! Please refresh the page.
| Fire incidents reported | |
|---|---|
| Sreet name | Count |
| 1ST AVE | 94 |
| ROUTE 30 | 76 |
| 5TH AVE | 72 |
| MCNEIL RD | 70 |
| DIXON AVE | 66 |
| ROCK FALLS RD | 62 |
| PROPHET RD | 60 |
| 2ND | 52 |
| MARTIN RD | 52 |
| 2ND ST | 48 |
| RIVERDALE RD | 46 |
| 8TH AVE | 44 |
| AVENUE A | 44 |
| 7TH AVE | 42 |
| BUELL RD | 40 |
| 3RD AVE | 34 |
| KNIEF RD | 34 |
| 18TH ST | 32 |
| HOOVER RD | 32 |
| RT 30 | 32 |
| THOME RD | 32 |
| 11TH AVE | 30 |
| 6TH AVE | 30 |
| 6TH | 26 |
| AVENUE D | 26 |
| 13TH AVE | 24 |
| 4TH AVE | 24 |
| EMMONS AVE | 24 |
| FRENCH ST | 24 |
| 14TH AVE | 22 |
| Other | 199 |
2002 - 2018 National Fire Incident Reporting System (NFIRS) incidents
- Incident types reported to NFIRS in Rock Falls, IL
- 2,25331.2%Rescue & EMS
- 1,49320.7%Fire
- 1,45120.1%Hazardous Condition
- 77310.7%Service Call
- 6138.5%Good Intent Call
- 5818.0%False Alarm
- 260.4%Severe Weather
- 200.3%Overpressure Rupture
- 140.2%Special Incident
- Fire incident types reported to NFIRS in Rock Falls, IL
- 77551.9%Structure Fires
- 49933.4%Outside Fires
- 17811.9%Mobile Property/Vehicle Fires
- 412.7%Other
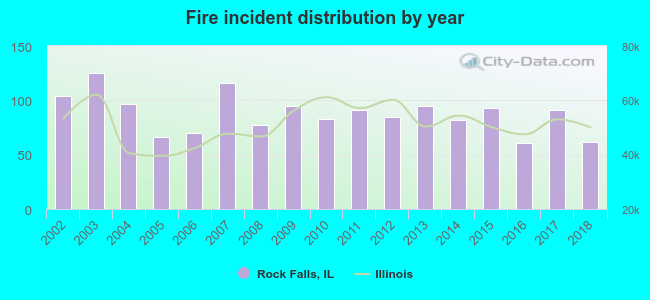 According to the data from the years 2002 - 2018 the average number of fire incidents per year is 88. The highest number of fires - 125 took place in 2003, and the least - 61 in 2016. The data has a decreasing trend.
The average number of yearly fire incidents per 10k residents in Rock Falls, IL compared to nearest cities:
(Note: Based on data for the last 3 years, including only cities with population 5,000 and above)
| Rock Falls: | 78.7 |
| Sterling: | 79.1 |
| Dixon: | 92.5 |
| Princeton: | 61.1 |
| Geneseo: | 44.9 |
| Mendota: | 56.5 |
| Rochelle: | 65.7 |
| Freeport: | 49.9 |
 The median response time based on all reported fire incidents is 7 minutes. This is higher compared to the state median value.
The median response time in Rock Falls, IL compared to nearest cities:
(Note: Based on data for all years, including only cities with at least 500 fire incidents)
| Rock Falls: | 7 minutes |
| Sterling: | 8 minutes |
| Dixon: | 7 minutes |
| Morrison: | 7 minutes |
| Polo: | 12 minutes |
| Amboy: | 11 minutes |
| Oregon: | 8 minutes |
| Princeton: | 8 minutes |
| Savanna: | 8 minutes |
 Based on the reports from the years 2002 - 2018 the average number of fire-related yearly deaths is 0. The highest number of reported deaths - 5 took place in 2016, and the lowest - 0 in 2002. The data has a constant trend.
 Based on the reports from the years 2002 - 2018 the average number of fire-related casualties per year is 2. The highest number of casualties - 6 took place in 2017, and the lowest - 0 in 2006. The data has a declining trend.
The average number of casualties per 1,000 fire incidents is 24. This indicator was the highest - 66 in 2017, and the lowest 0 in 2006. The trend for casualties per 1,000 fires is decreasing. Compared to the Illinois value the number of injuries per 1,000 fires is much higher.
Based on the reports from the years 2002 - 2018 the average number of fire-related casualties per year is 2. The highest number of casualties - 6 took place in 2017, and the lowest - 0 in 2006. The data has a declining trend.
The average number of casualties per 1,000 fire incidents is 24. This indicator was the highest - 66 in 2017, and the lowest 0 in 2006. The trend for casualties per 1,000 fires is decreasing. Compared to the Illinois value the number of injuries per 1,000 fires is much higher.
 31.5% incidents where reported in the morning and 68.5% in the evening. The most fires (16.1%) took place on Saturday, and the least (12.5%) on Wednesday.
 Based on the 1,493 reports from years 2002 - 2018 most fires (13.1%) took place during April, and the least (4.4%) in February.
 Out of all 7,224 cases reported during the years 2002 - 2018, the most belonged to the categories: Rescue & EMS (31.2%), Fire (20.7%), and Hazardous Condition (20.1%).
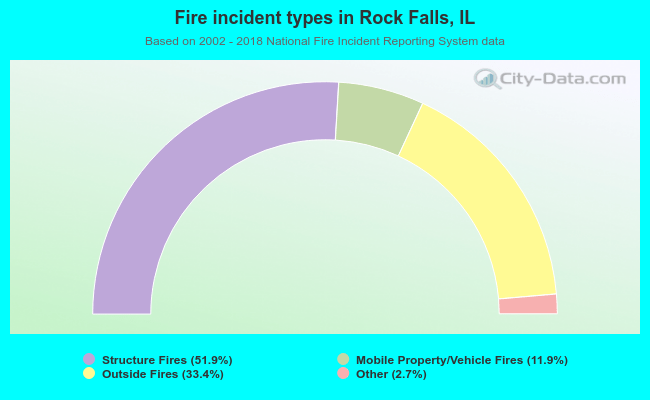 When looking into fire subcategories, the most incidents belonged to: Structure Fires (51.9%), and Outside Fires (33.4%).