Freeport: Fire Incidents, Illinois (IL)
Where are fire incidents reported in Freeport, IL
Something went wrong! Please refresh the page.
| Fire incidents reported | |
|---|---|
| Sreet name | Count |
| GALENA AVE | 188 |
| STEPHENSON ST | 106 |
| WALNUT AVE | 76 |
| ADAMS AVE | 56 |
| CHICAGO AVE | 56 |
| OAK AVE | 52 |
| LAMM RD | 48 |
| PLEASANT ST | 48 |
| WEST AVE | 48 |
| LIBERTY AVE | 44 |
| HENDERSON RD | 42 |
| IROQUOIS ST | 42 |
| ELK ST | 40 |
| EMPIRE ST | 40 |
| VAN BUREN AVE | 40 |
| STATE AVE | 38 |
| CHERRY AVE | 36 |
| DOUGLAS ST | 36 |
| PARK BLVD | 34 |
| SHAWNEE ST | 34 |
| FLOAT AVE | 32 |
| CHESTNUT ST | 30 |
| HARLEM AVE | 30 |
| MAIN ST | 30 |
| GREENFIELD DR | 28 |
| WADDELL AVE | 28 |
| AMERICAN ST | 26 |
| AVON ST | 24 |
| SOUTH ST | 24 |
| WYANDOTTE ST | 24 |
| Other | 492 |
2004 - 2018 National Fire Incident Reporting System (NFIRS) incidents
- Incident types reported to NFIRS in Freeport, IL
- 14,10565.6%Rescue & EMS
- 2,0239.4%Service Call
- 1,8728.7%Fire
- 1,7978.4%Hazardous Condition
- 1,1065.1%False Alarm
- 5502.6%Good Intent Call
- 220.1%Overpressure Rupture
- 220.1%Special Incident
- Fire incident types reported to NFIRS in Freeport, IL
- 82143.9%Outside Fires
- 73939.5%Structure Fires
- 19110.2%Mobile Property/Vehicle Fires
- 1216.5%Other
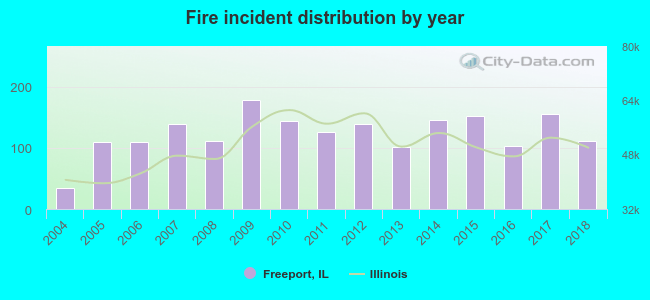 According to the data from the years 2004 - 2018 the average number of fire incidents per year is 124. The highest number of fires - 178 took place in 2009, and the least - 34 in 2004. The data has a rising trend.
The average number of yearly fire incidents per 10k residents in Freeport, IL compared to nearest cities:
(Note: Based on data for the last 3 years, including only cities with population 5,000 and above)
| Freeport: | 49.9 |
| Rockford: | 49.6 |
| Machesney Park: | 32.0 |
| Rockton: | 74.1 |
| Loves Park: | 28.6 |
| Dixon: | 92.5 |
| Roscoe: | 46.8 |
| South Beloit: | 46.2 |
| Sterling: | 79.1 |
 The median response time based on all reported fire incidents is 5 minutes. This is about the same as the Illinois median value.
The median response time in Freeport, IL compared to nearest cities:
(Note: Based on data for all years, including only cities with at least 500 fire incidents)
| Freeport: | 5 minutes |
| Winnebago: | 12 minutes |
| Polo: | 12 minutes |
| Byron: | 7 minutes |
| Oregon: | 8 minutes |
| Rockford: | 5 minutes |
| Savanna: | 8 minutes |
| Machesney Park: | 7 minutes |
| Rockton: | 7 minutes |
 Based on the data from the years 2004 - 2018 the average number of fire-related fatalities per year is 0. The highest number of deaths - 2 took place in 2011, and the lowest - 0 in 2004. The data has a constant trend.
 Based on the data from the years 2004 - 2018 the average number of fire-related yearly casualties is 1. The highest number of casualties - 5 took place in 2014, and the lowest - 0 in 2004. The data has a growing trend.
The average number of casualties per 1,000 fire incidents is 11. This indicator was the highest - 34 in 2014, and the lowest 0 in 2004. The trend for injuries per 1,000 fire incidents is increasing. Compared to the state value the number of casualties per 1,000 incidents is similar.
Based on the data from the years 2004 - 2018 the average number of fire-related yearly casualties is 1. The highest number of casualties - 5 took place in 2014, and the lowest - 0 in 2004. The data has a growing trend.
The average number of casualties per 1,000 fire incidents is 11. This indicator was the highest - 34 in 2014, and the lowest 0 in 2004. The trend for injuries per 1,000 fire incidents is increasing. Compared to the state value the number of casualties per 1,000 incidents is similar.
 30.1% incidents where reported in the morning and 69.9% in the evening. The most fires (15.5%) took place on Saturday, and the least (12.3%) on Tuesday.
 Based on the 1,872 fire incidents from years 2004 - 2018 most fires (13.4%) took place during April, and the least (5.3%) in February.
 Out of all 21,515 cases reported during the years 2004 - 2018, the most belonged to the categories: Rescue & EMS (65.6%), Service Call (9.4%), and Fire (8.7%).
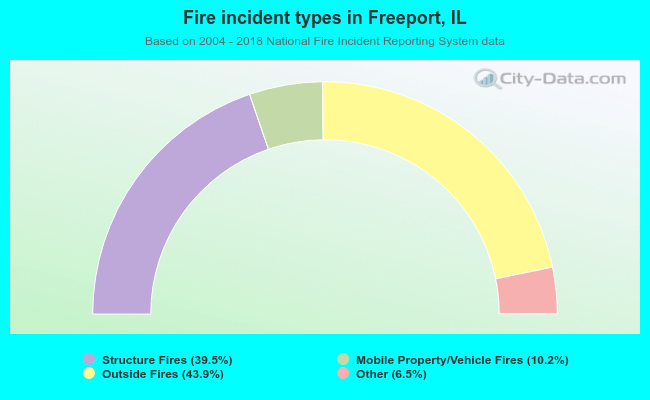 When looking into fire subcategories, the most reports belonged to: Outside Fires (43.9%), and Structure Fires (39.5%).