Dixon: Fire Incidents, Illinois (IL)
Where are fire incidents reported in Dixon, IL
Something went wrong! Please refresh the page.
| Fire incidents reported | |
|---|---|
| Sreet name | Count |
| GALENA AVE | 144 |
| IL RT 2 | 110 |
| PALMYRA RD | 82 |
| 3RD ST | 80 |
| 1ST ST | 72 |
| LOST NATION RD | 56 |
| 4TH ST | 52 |
| MONROE AVE | 50 |
| IL RT 26 | 48 |
| 2ND ST | 46 |
| LINCOLN AVE | 46 |
| COLLEGE AVE | 42 |
| STONEY POINT RD | 42 |
| WASHINGTON AVE | 42 |
| NACHUSA RD | 40 |
| RIVER RD | 40 |
| WHITE OAK LN | 40 |
| LOWELL PARK RD | 38 |
| ROCK ISLAND RD | 36 |
| PEORIA AVE | 34 |
| JEFFERSON AVE | 32 |
| BRINTON AVE | 28 |
| OTTAWA AVE | 28 |
| PILGRIM RD | 26 |
| ANCHOR RD | 24 |
| KILGORE RD | 24 |
| US RT 52 | 24 |
| BLOODY GULCH RD | 22 |
| DEPOT AVE | 22 |
| GRAND DETOUR RD | 20 |
| Other | 504 |
2003 - 2018 National Fire Incident Reporting System (NFIRS) incidents
- Incident types reported to NFIRS in Dixon, IL
- 8,03265.9%Rescue & EMS
- 1,89415.5%Fire
- 1,2049.9%Hazardous Condition
- 5894.8%False Alarm
- 2842.3%Good Intent Call
- 1651.4%Service Call
- 160.1%Overpressure Rupture
- Fire incident types reported to NFIRS in Dixon, IL
- 83444.0%Structure Fires
- 69736.8%Outside Fires
- 21511.4%Mobile Property/Vehicle Fires
- 1487.8%Other
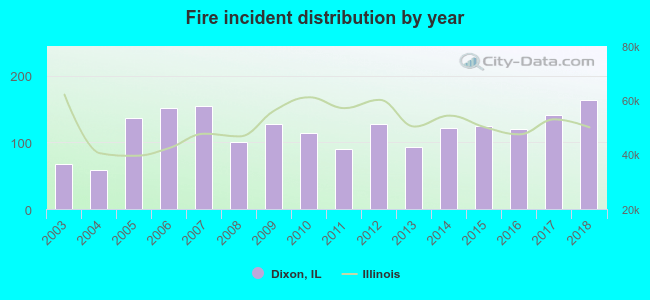 Based on the data from the years 2003 - 2018 the average number of fire incidents per year is 118. The highest number of reported fire incidents - 163 took place in 2018, and the least - 59 in 2004. The data has a growing trend.
The average number of yearly fire incidents per 10k residents in Dixon, IL compared to nearest cities:
(Note: Based on data for the last 3 years, including only cities with population 5,000 and above)
| Dixon: | 92.5 |
| Sterling: | 79.1 |
| Rock Falls: | 78.7 |
| Rochelle: | 65.7 |
| Mendota: | 56.5 |
| Freeport: | 49.9 |
| Princeton: | 61.1 |
| Rockford: | 49.6 |
 The median response time based on all reported fire incidents is 7 minutes. This is higher compared to the state median value.
The median response time in Dixon, IL compared to nearest cities:
(Note: Based on data for all years, including only cities with at least 500 fire incidents)
| Dixon: | 7 minutes |
| Polo: | 12 minutes |
| Sterling: | 8 minutes |
| Rock Falls: | 7 minutes |
| Amboy: | 11 minutes |
| Oregon: | 8 minutes |
| Rochelle: | 7 minutes |
| Byron: | 7 minutes |
| Morrison: | 7 minutes |
 Based on the data from the years 2003 - 2018 the average number of fire-related fatalities per year is 1. The highest number of reported deaths - 8 took place in 2017, and the lowest - 0 in 2003. The data has a constant trend.
 According to the reports from the years 2003 - 2018 the average number of fire-related yearly casualties is 1. The highest number of casualties - 5 took place in 2017, and the lowest - 0 in 2003. The data has a constant trend.
The average number of casualties per 1,000 fires is 8. This indicator was the highest - 35 in 2017, and the lowest 0 in 2003. The trend for casualties per 1,000 fire incidents is constant. Compared to the state value the number of casualties per 1,000 fire incidents is lower.
According to the reports from the years 2003 - 2018 the average number of fire-related yearly casualties is 1. The highest number of casualties - 5 took place in 2017, and the lowest - 0 in 2003. The data has a constant trend.
The average number of casualties per 1,000 fires is 8. This indicator was the highest - 35 in 2017, and the lowest 0 in 2003. The trend for casualties per 1,000 fire incidents is constant. Compared to the state value the number of casualties per 1,000 fire incidents is lower.
 34.1% incidents where reported in the morning and 65.9% in the evening. The most fires (19.2%) took place on Saturday, and the least (12.5%) on Wednesday.
 Based on the 1,894 reports from years 2003 - 2018 most fires (12.3%) took place during April, and the least (5.4%) in January.
 Out of all 12,194 cases reported during the years 2003 - 2018, the most belonged to the categories: Rescue & EMS (65.9%), Fire (15.5%), and Hazardous Condition (9.9%).
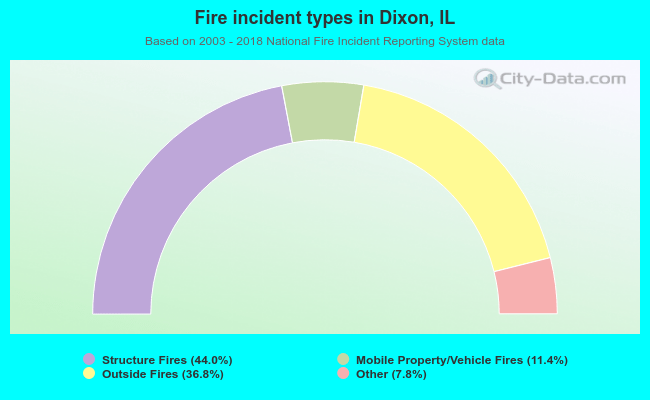 When looking into fire subcategories, the most reports belonged to: Structure Fires (44.0%), and Outside Fires (36.8%).