Machesney Park: Fire Incidents, Illinois (IL)
Where are fire incidents reported in Machesney Park, IL
Something went wrong! Please refresh the page.
| Fire incidents reported | |
|---|---|
| Sreet name | Count |
| 2ND ST | 142 |
| SECOND ST | 86 |
| HARLEM RD | 66 |
| W LANE RD | 66 |
| ALPINE RD | 48 |
| MARQUETTE RD | 44 |
| RAMONA TER | 40 |
| SHORE DR | 38 |
| WILSON AVE | 38 |
| MINNS DR | 36 |
| VENTURA BLVD | 36 |
| WOOD AVE | 36 |
| CADET RD | 34 |
| MILDRED RD | 34 |
| WILSHIRE BLVD | 34 |
| MARIE AVE | 32 |
| RAVERE ST | 32 |
| EVANS AVE | 30 |
| GREENVIEW AVE | 30 |
| I-90 | 30 |
| LIBERTY BLVD | 30 |
| PRODUCT DR | 30 |
| DREXEL BLVD | 28 |
| OTTO RD | 28 |
| SCOTT LANE | 28 |
| SUPERIOR AVE | 28 |
| WALLACE AVE | 28 |
| DELTA DR | 26 |
| WINONA DR | 26 |
| FOREST HILLS RD | 24 |
| Other | 171 |
2002 - 2018 National Fire Incident Reporting System (NFIRS) incidents
- Incident types reported to NFIRS in Machesney Park, IL
- 8,99063.5%Rescue & EMS
- 1,71912.1%Hazardous Condition
- 1,3799.7%Fire
- 9496.7%Good Intent Call
- 6214.4%False Alarm
- 4683.3%Service Call
- Fire incident types reported to NFIRS in Machesney Park, IL
- 73253.1%Structure Fires
- 35525.7%Outside Fires
- 18413.3%Mobile Property/Vehicle Fires
- 1087.8%Other
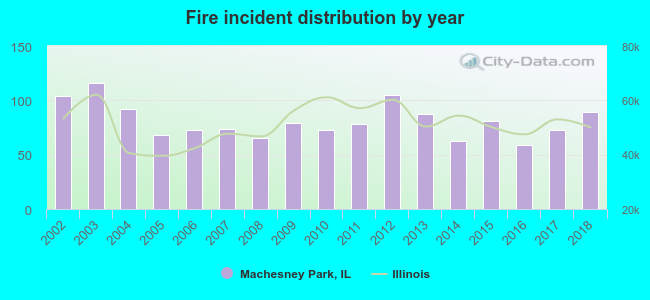 Based on the data from the years 2002 - 2018 the average number of fires per year is 81. The highest number of fires - 116 took place in 2003, and the least - 59 in 2016. The data has a decreasing trend.
The average number of yearly fire incidents per 10k residents in Machesney Park, IL compared to nearest cities:
(Note: Based on data for the last 3 years, including only cities with population 5,000 and above)
| Machesney Park: | 32.0 |
| Loves Park: | 28.6 |
| Roscoe: | 46.8 |
| Rockford: | 49.6 |
| Rockton: | 74.1 |
| South Beloit: | 46.2 |
| Poplar Grove: | 31.0 |
| Belvidere: | 48.8 |
| Harvard: | 53.8 |
 The median response time based on all reported fire incidents is 7 minutes. This is higher than the Illinois median value.
The median response time in Machesney Park, IL compared to nearest cities:
(Note: Based on data for all years, including only cities with at least 500 fire incidents)
| Machesney Park: | 7 minutes |
| Loves Park: | 9 minutes |
| Roscoe: | 6 minutes |
| Rockford: | 5 minutes |
| Rockton: | 7 minutes |
| Winnebago: | 12 minutes |
| Belvidere: | 5 minutes |
| Byron: | 7 minutes |
| Harvard: | 9 minutes |
 Based on the data from the years 2002 - 2018 the average number of fire-related casualties per year is 1. The highest number of reported injuries - 2 took place in 2002, and the lowest - 0 in 2004. The data has a decreasing trend.
The average number of injuries per 1,000 fires is 7. This indicator was the highest - 27 in 2007, and the lowest 0 in 2004. The trend for injuries per 1,000 fires is declining. Compared to the Illinois value the number of injuries per 1,000 fire incidents is lower.
Based on the data from the years 2002 - 2018 the average number of fire-related casualties per year is 1. The highest number of reported injuries - 2 took place in 2002, and the lowest - 0 in 2004. The data has a decreasing trend.
The average number of injuries per 1,000 fires is 7. This indicator was the highest - 27 in 2007, and the lowest 0 in 2004. The trend for injuries per 1,000 fires is declining. Compared to the Illinois value the number of injuries per 1,000 fire incidents is lower.
 29.8% incidents where reported in the morning and 70.2% in the evening. The most fires (18.1%) took place on Friday, and the least (11.2%) on Tuesday.
 Based on the 1,379 fire incidents from years 2002 - 2018 most fires (12.1%) took place during July, and the least (6.0%) in December.
 Out of all 14,153 cases reported during the years 2002 - 2018, the most belonged to the categories: Rescue & EMS (63.5%), Hazardous Condition (12.1%), and Fire (9.7%).
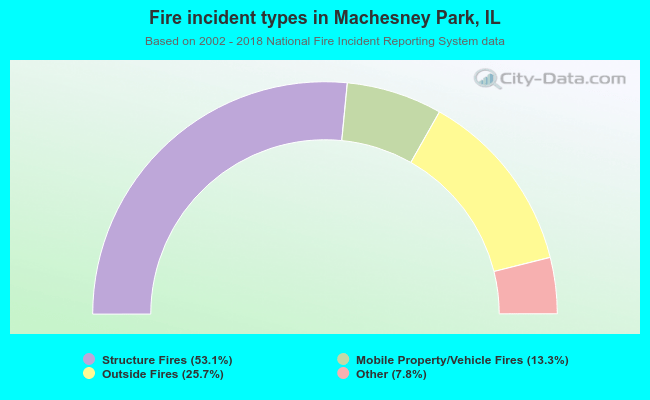 When looking into fire subcategories, the most incidents belonged to: Structure Fires (53.1%), and Outside Fires (25.7%).