Pleasanton: Fire Incidents, California (CA)
Where are fire incidents reported in Pleasanton, CA
Something went wrong! Please refresh the page.
| Fire incidents reported | |
|---|---|
| Sreet name | Count |
| OWENS DR | 84 |
| I580 | 78 |
| SANTA RITA RD | 72 |
| I680 | 66 |
| STONERIDGE MALL RD | 58 |
| EB I580 | 54 |
| STANLEY BL | 48 |
| FOOTHILL RD | 42 |
| HOPYARD RD | 42 |
| ROSEWOOD DR | 40 |
| JOHNSON DR | 36 |
| MAIN ST | 32 |
| STONERIDGE DR | 30 |
| STANLEY | 28 |
| VINEYARD AVE | 28 |
| SPRINGHOUSE DR | 26 |
| VALLEY AVE | 26 |
| BUSCH RD | 24 |
| DUBLIN CANYON RD | 24 |
| NB I680 | 24 |
| BERNAL AV | 22 |
| WB I580 | 22 |
| BERNAL AVE | 20 |
| SB I680 | 20 |
| STANLEY BL | 20 |
| VINEYARD AV | 20 |
| WILLOW RD | 20 |
| ANDREWS DR | 18 |
| BERNAL | 18 |
| VALLEY AV | 18 |
| Other | 428 |
2005 - 2018 National Fire Incident Reporting System (NFIRS) incidents
- Incident types reported to NFIRS in Pleasanton, CA
- 16,13562.0%Rescue & EMS
- 4,13715.9%Good Intent Call
- 1,6416.3%False Alarm
- 1,6126.2%Service Call
- 1,4885.7%Fire
- 9713.7%Hazardous Condition
- 310.1%Overpressure Rupture
- Fire incident types reported to NFIRS in Pleasanton, CA
- 63142.4%Outside Fires
- 46931.5%Structure Fires
- 32421.8%Mobile Property/Vehicle Fires
- 644.3%Other
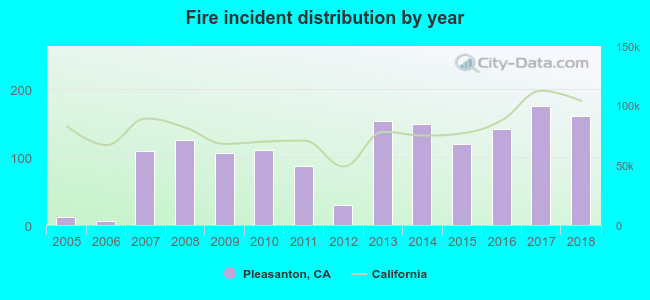 Based on the data from the years 2005 - 2018 the average number of fire incidents per year is 106. The highest number of fires - 176 took place in 2017, and the least - 6 in 2006. The data has a growing trend.
The average number of yearly fire incidents per 10k residents in Pleasanton, CA compared to nearest cities:
(Note: Based on data for the last 3 years, including only cities with population 5,000 and above)
| Pleasanton: | 20.6 |
| Dublin: | 24.0 |
| Livermore: | 44.1 |
| San Ramon: | 12.6 |
| Blackhawk: | 9.6 |
| Fremont: | 19.8 |
| Union City: | 18.2 |
| Hayward: | 3.3 |
| Danville: | 11.8 |
 The median response time based on all reported fire incidents is 5 minutes. This is lower than the state median value.
The median response time in Pleasanton, CA compared to nearest cities:
(Note: Based on data for all years, including only cities with at least 500 fire incidents)
| Pleasanton: | 5 minutes |
| Dublin: | 5 minutes |
| Livermore: | 6 minutes |
| San Ramon: | 5 minutes |
| Fremont: | 5 minutes |
| Union City: | 5 minutes |
| Hayward: | 4 minutes |
| Danville: | 6 minutes |
| Castro Valley: | 5 minutes |
 According to the data from the years 2005 - 2018 the average number of fire-related casualties per year is 0. The highest number of injuries - 2 took place in 2007, and the lowest - 0 in 2005. The data has a constant trend.
The average number of injuries per 1,000 fire incidents is 3. This indicator was the highest - 18 in 2007, and the lowest 0 in 2005. The trend for casualties per 1,000 incidents is constant. Compared to the California value the number of casualties per 1,000 incidents is lower.
According to the data from the years 2005 - 2018 the average number of fire-related casualties per year is 0. The highest number of injuries - 2 took place in 2007, and the lowest - 0 in 2005. The data has a constant trend.
The average number of injuries per 1,000 fire incidents is 3. This indicator was the highest - 18 in 2007, and the lowest 0 in 2005. The trend for casualties per 1,000 incidents is constant. Compared to the California value the number of casualties per 1,000 incidents is lower.Casualties per 1,000 incidents in Pleasanton, CA compared to nearest cities:
(Note: Based on data for all years, including only cities with at least 500 fire incidents)
| Pleasanton: | 4.0 |
| Dublin: | 1.9 |
| Livermore: | 3.9 |
| San Ramon: | 0.0 |
| Fremont: | 6.6 |
| Union City: | 1.4 |
| Hayward: | 1.8 |
| Danville: | 0.0 |
| Castro Valley: | 0.9 |
 28.1% incidents where reported in the morning and 71.9% in the evening. The most fires (15.1%) took place on Sunday, and the least (13.4%) on Saturday.
 According to the 1,488 fire incident reports from years 2005 - 2018 most fires (15.6%) took place during July, and the least (5.0%) in February.
 Out of all 26,036 cases reported during the years 2005 - 2018, the most belonged to the categories: Rescue & EMS (62.0%), Good Intent Call (15.9%), and False Alarm (6.3%).
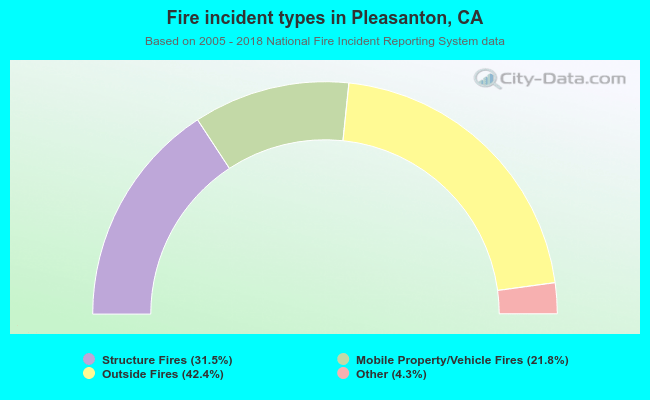 When looking into fire subcategories, the most incidents belonged to: Outside Fires (42.4%), and Structure Fires (31.5%).