Fremont: Fire Incidents, California (CA)
Where are fire incidents reported in Fremont, CA
Something went wrong! Please refresh the page.
| Fire incidents reported | |
|---|---|
| Sreet name | Count |
| FREMONT BL | 312 |
| FREMONT | 172 |
| I880 | 172 |
| FREMONT BL | 132 |
| I680 | 118 |
| PASEO PADRE PW | 118 |
| MISSION BL | 106 |
| MOWRY AV | 104 |
| MISSION BL | 96 |
| STEVENSON BL | 84 |
| PASEO PADRE PW | 80 |
| MOWRY AV | 78 |
| LOGAN DR | 68 |
| MOWRY | 68 |
| BLACOW RD | 64 |
| SUNDALE DR | 60 |
| STEVENSON | 58 |
| MISSION | 52 |
| GRIMMER BL | 48 |
| PASEO PADRE | 48 |
| AUTO MALL PW | 46 |
| THORNTON AV | 46 |
| BLACOW RD | 44 |
| WARWICK RD | 44 |
| NILES BL | 40 |
| CIVIC CENTER DR | 38 |
| SB880 | 38 |
| CENTRAL AV | 34 |
| WALNUT AV | 34 |
| WARM SPRINGS BL | 34 |
| Other | 1,684 |
2005 - 2018 National Fire Incident Reporting System (NFIRS) incidents
- Incident types reported to NFIRS in Fremont, CA
- 40,91662.1%Rescue & EMS
- 9,83314.9%Good Intent Call
- 4,2626.5%Service Call
- 4,1676.3%False Alarm
- 4,1206.3%Fire
- 2,3473.6%Hazardous Condition
- 1610.2%Special Incident
- Fire incident types reported to NFIRS in Fremont, CA
- 1,69541.1%Outside Fires
- 1,63139.6%Structure Fires
- 79019.2%Mobile Property/Vehicle Fires
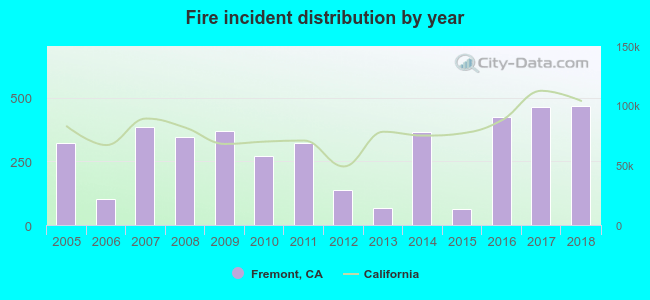 According to the data from the years 2005 - 2018 the average number of fires per year is 294. The highest number of fires - 469 took place in 2018, and the least - 64 in 2015. The data has a rising trend.
The average number of yearly fire incidents per 10k residents in Fremont, CA compared to nearest cities:
(Note: Based on data for the last 3 years, including only cities with population 5,000 and above)
| Fremont: | 19.8 |
| Newark: | 22.2 |
| Union City: | 18.2 |
| Hayward: | 3.3 |
| Milpitas: | 12.6 |
| East Palo Alto: | 20.3 |
| Pleasanton: | 20.6 |
| Palo Alto: | 18.5 |
| Mountain View: | 5.5 |
 The median response time based on all reported fire incidents is 5 minutes. This is lower compared to the state median value.
The median response time in Fremont, CA compared to nearest cities:
(Note: Based on data for all years, including only cities with at least 500 fire incidents)
| Fremont: | 5 minutes |
| Newark: | 4 minutes |
| Union City: | 5 minutes |
| Hayward: | 4 minutes |
| Milpitas: | 5 minutes |
| East Palo Alto: | 4 minutes |
| Pleasanton: | 5 minutes |
| Palo Alto: | 6 minutes |
| Mountain View: | 5 minutes |
 According to the data from the years 2005 - 2018 the average number of fire-related yearly casualties is 2. The highest number of injuries - 8 took place in 2005, and the lowest - 0 in 2010. The data has a dropping trend.
The average number of injuries per 1,000 fire incidents is 8. This indicator was the highest - 25 in 2005, and the lowest 0 in 2010. The trend for casualties per 1,000 fire incidents is declining. Compared to the state value the number of injuries per 1,000 incidents is similar.
According to the data from the years 2005 - 2018 the average number of fire-related yearly casualties is 2. The highest number of injuries - 8 took place in 2005, and the lowest - 0 in 2010. The data has a dropping trend.
The average number of injuries per 1,000 fire incidents is 8. This indicator was the highest - 25 in 2005, and the lowest 0 in 2010. The trend for casualties per 1,000 fire incidents is declining. Compared to the state value the number of injuries per 1,000 incidents is similar.Casualties per 1,000 incidents in Fremont, CA compared to nearest cities:
(Note: Based on data for all years, including only cities with at least 500 fire incidents)
| Fremont: | 6.6 |
| Newark: | 0.0 |
| Union City: | 1.4 |
| Hayward: | 1.8 |
| Milpitas: | 5.1 |
| East Palo Alto: | 6.1 |
| Pleasanton: | 4.0 |
| Palo Alto: | 3.0 |
| Mountain View: | 4.7 |
 30.7% incidents where reported in the morning and 69.3% in the evening. The most fires (15.5%) took place on Sunday, and the least (13.0%) on Thursday.
 Based on the 4,120 fire incidents from years 2005 - 2018 most fires (12.0%) took place during July, and the least (4.6%) in November.
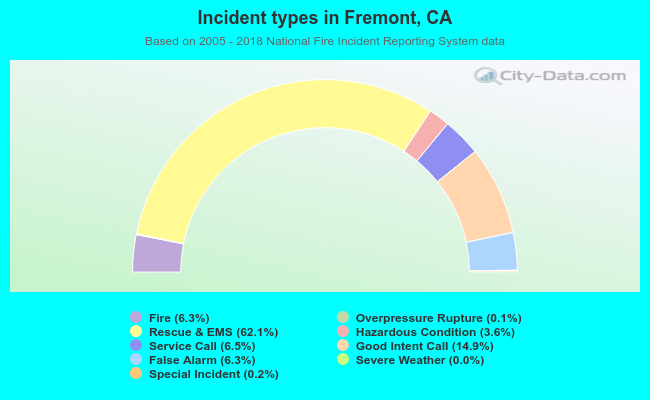 Out of all 65,871 cases reported during the years 2005 - 2018, the most belonged to the categories: Rescue & EMS (62.1%), Good Intent Call (14.9%), and Service Call (6.5%).
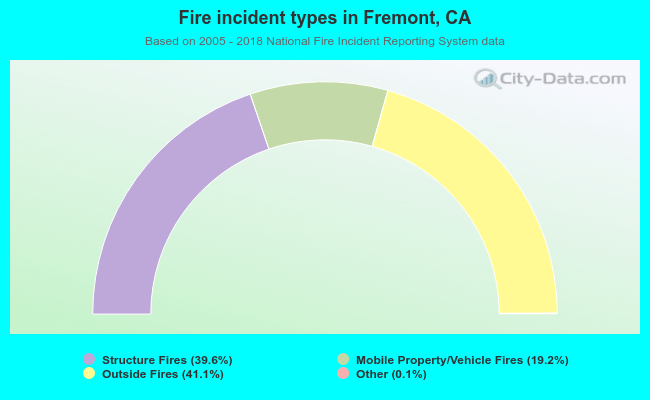 When looking into fire subcategories, the most incidents belonged to: Outside Fires (41.1%), and Structure Fires (39.6%).