Palo Alto: Fire Incidents, California (CA)
Where are fire incidents reported in Palo Alto, CA
Something went wrong! Please refresh the page.
| Fire incidents reported | |
|---|---|
| Sreet name | Count |
| EL CAMINO REAL | 126 |
| UNIVERSITY AVE | 70 |
| UNIVERSITY AV | 68 |
| MIDDLEFIELD RD | 66 |
| ARASTRADERO RD | 56 |
| ALMA ST | 50 |
| EMBARCADERO RD | 42 |
| BRYANT ST | 38 |
| COWPER ST | 38 |
| PAGE MILL RD | 34 |
| MEADOW DR | 32 |
| BAYSHORE RD | 30 |
| EMERSON ST | 28 |
| SAND HILL RD | 26 |
| CALIFORNIA AV | 24 |
| WAVERLEY ST | 22 |
| CHARLESTON RD | 20 |
| HAMILTON AV | 18 |
| PASTEUR DR | 18 |
| RAMONA ST | 18 |
| HAMILTON AVE | 16 |
| LYTTON AVE | 16 |
| PARK BLVD | 16 |
| WELCH RD | 16 |
| CALIFORNIA AVE | 14 |
| FOREST AVE | 14 |
| NB 280 HWY | 14 |
| CHANNING AV | 12 |
| GREER RD | 12 |
| LOUIS RD | 12 |
| Other | 25 |
2007 - 2018 National Fire Incident Reporting System (NFIRS) incidents
- Incident types reported to NFIRS in Palo Alto, CA
- 18,51161.9%Rescue & EMS
- 4,50115.0%Good Intent Call
- 2,8839.6%False Alarm
- 1,6445.5%Service Call
- 1,1633.9%Hazardous Condition
- 9913.3%Fire
- 2250.8%Special Incident
- Fire incident types reported to NFIRS in Palo Alto, CA
- 39640.0%Structure Fires
- 34434.7%Outside Fires
- 13613.7%Mobile Property/Vehicle Fires
- 11511.6%Other
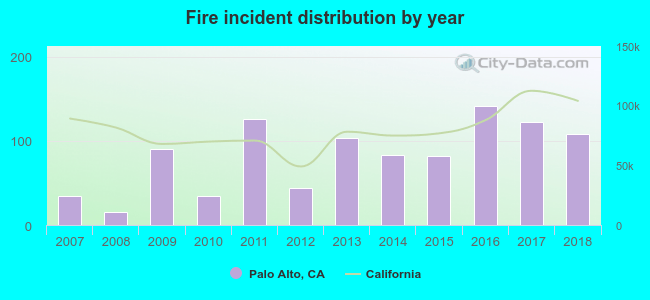 Based on the data from the years 2007 - 2018 the average number of fires per year is 82. The highest number of fire incidents - 142 took place in 2016, and the least - 16 in 2008. The data has a rising trend.
The average number of yearly fire incidents per 10k residents in Palo Alto, CA compared to nearest cities:
(Note: Based on data for the last 3 years, including only cities with population 5,000 and above)
| Palo Alto: | 18.5 |
| Stanford: | 21.7 |
| East Palo Alto: | 20.3 |
| Menlo Park: | 21.6 |
| Atherton: | 10.3 |
| Mountain View: | 5.5 |
| Los Altos Hills: | 22.2 |
| Los Altos: | 11.9 |
| Redwood City: | 23.3 |
 The median response time based on all reported fire incidents is 6 minutes. This is comparable to the California median value.
The median response time in Palo Alto, CA compared to nearest cities:
(Note: Based on data for all years, including only cities with at least 500 fire incidents)
| Palo Alto: | 6 minutes |
| East Palo Alto: | 4 minutes |
| Menlo Park: | 4 minutes |
| Mountain View: | 5 minutes |
| Redwood City: | 5 minutes |
| Sunnyvale: | 5 minutes |
| San Carlos: | 5 minutes |
| Newark: | 4 minutes |
| Cupertino: | 5 minutes |
 According to the reports from the years 2007 - 2018 the average number of fire-related yearly casualties is 0. The highest number of reported injuries - 1 took place in 2011, and the lowest - 0 in 2007. The data has a constant trend.
The average number of casualties per 1,000 fires is 2. This indicator was the highest - 12 in 2015, and the lowest 0 in 2007. The trend for injuries per 1,000 incidents is constant. Compared to the California value the number of casualties per 1,000 fires is lower.
According to the reports from the years 2007 - 2018 the average number of fire-related yearly casualties is 0. The highest number of reported injuries - 1 took place in 2011, and the lowest - 0 in 2007. The data has a constant trend.
The average number of casualties per 1,000 fires is 2. This indicator was the highest - 12 in 2015, and the lowest 0 in 2007. The trend for injuries per 1,000 incidents is constant. Compared to the California value the number of casualties per 1,000 fires is lower.Casualties per 1,000 incidents in Palo Alto, CA compared to nearest cities:
(Note: Based on data for all years, including only cities with at least 500 fire incidents)
| Palo Alto: | 3.0 |
| East Palo Alto: | 6.1 |
| Menlo Park: | 2.6 |
| Mountain View: | 4.7 |
| Redwood City: | 6.8 |
| Sunnyvale: | 18.3 |
| San Carlos: | 0.0 |
| Newark: | 0.0 |
| Cupertino: | 13.3 |
 30.4% incidents where reported in the morning and 69.6% in the evening. The most fires (16.1%) took place on Friday, and the least (13.1%) on Sunday.
 According to the 991 fire incident reports from years 2007 - 2018 most fires (11.7%) took place during July, and the least (5.5%) in November.
 Out of all 29,923 cases reported during the years 2007 - 2018, the most belonged to the categories: Rescue & EMS (61.9%), Good Intent Call (15.0%), and False Alarm (9.6%).
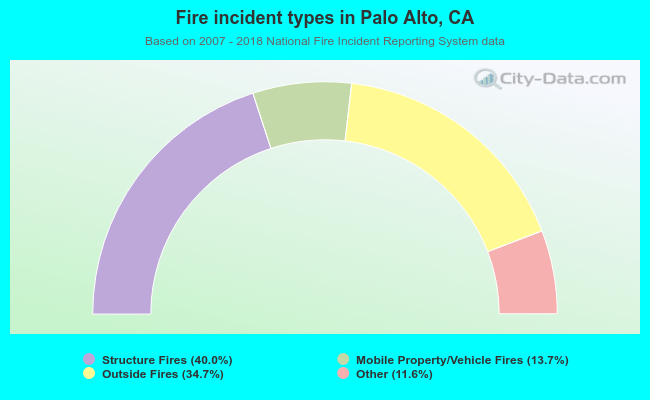 When looking into fire subcategories, the most reports belonged to: Structure Fires (40.0%), and Outside Fires (34.7%).