Castro Valley: Fire Incidents, California (CA)
Where are fire incidents reported in Castro Valley, CA
Something went wrong! Please refresh the page.
| Fire incidents reported | |
|---|---|
| Sreet name | Count |
| I580 | 156 |
| REDWOOD RD | 90 |
| CENTER ST | 54 |
| LAKE CHABOT RD | 50 |
| REDWOOD RD | 50 |
| CROW CANYON RD | 46 |
| CASTRO VALLEY BLVD | 42 |
| CASTRO VALLEY | 34 |
| CULL CANYON RD | 32 |
| CASTRO VALLEY BL | 28 |
| EB580 | 26 |
| PALOMARES RD | 26 |
| WB580 | 26 |
| WISTERIA ST | 26 |
| GROVE WY | 24 |
| LAKE CHABOT RD | 24 |
| SANTA MARIA AVE | 22 |
| CASTRO VALLEY BL | 20 |
| CROW CANYON RD | 20 |
| GROVE WY | 20 |
| MARSHALL ST | 20 |
| WILBEAM AV | 18 |
| GROVE WAY | 16 |
| SANTA MARIA AV | 16 |
| SANTA MARIA | 14 |
| SOMERSET AV | 14 |
| ALMOND RD | 12 |
| EB580 FWY | 12 |
| FOREST AV | 12 |
| NORBRIDGE | 12 |
| Other | 151 |
2005 - 2018 National Fire Incident Reporting System (NFIRS) incidents
- Incident types reported to NFIRS in Castro Valley, CA
- 9,46765.9%Rescue & EMS
- 1,4209.9%Good Intent Call
- 1,1137.8%Fire
- 9626.7%Service Call
- 8445.9%Hazardous Condition
- 5323.7%False Alarm
- Fire incident types reported to NFIRS in Castro Valley, CA
- 40936.7%Structure Fires
- 38734.8%Outside Fires
- 30127.0%Mobile Property/Vehicle Fires
- 161.4%Other
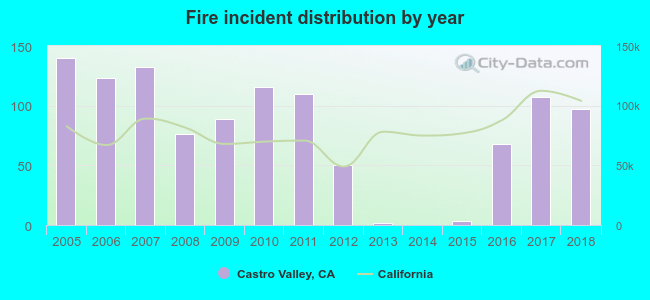 According to the data from the years 2005 - 2018 the average number of fire incidents per year is 80. The highest number of reported fires - 140 took place in 2005, and the least - 0 in 2014. The data has a dropping trend.
The average number of yearly fire incidents per 10k residents in Castro Valley, CA compared to nearest cities:
(Note: Based on data for the last 3 years, including only cities with population 5,000 and above)
| Castro Valley: | 14.8 |
| San Lorenzo: | 27.3 |
| San Leandro: | 33.1 |
| Hayward: | 3.3 |
| San Ramon: | 12.6 |
| Union City: | 18.2 |
| Dublin: | 24.0 |
| Danville: | 11.8 |
| Moraga: | 14.9 |
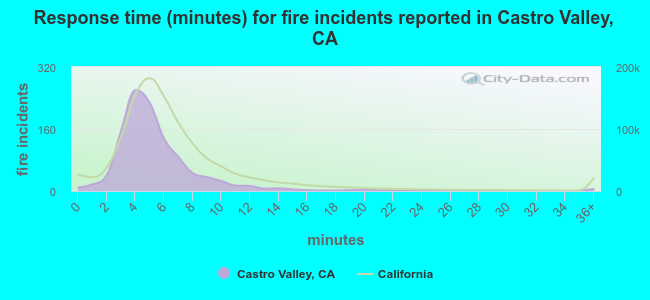 The median response time based on all reported fire incidents is 5 minutes. This is lower compared to the California median value.
The median response time in Castro Valley, CA compared to nearest cities:
(Note: Based on data for all years, including only cities with at least 500 fire incidents)
| Castro Valley: | 5 minutes |
| San Lorenzo: | 4 minutes |
| San Leandro: | 4 minutes |
| Hayward: | 4 minutes |
| San Ramon: | 5 minutes |
| Union City: | 5 minutes |
| Dublin: | 5 minutes |
| Danville: | 6 minutes |
| Oakland: | 5 minutes |
 33.2% incidents where reported in the morning and 66.8% in the evening. The most fires (17.7%) took place on Monday, and the least (12.1%) on Tuesday.
 Based on the 1,113 reports from years 2005 - 2018 most fires (11.0%) took place during July, and the least (5.2%) in April.
 Out of all 14,358 cases reported during the years 2005 - 2018, the most belonged to the categories: Rescue & EMS (65.9%), Good Intent Call (9.9%), and Fire (7.8%).
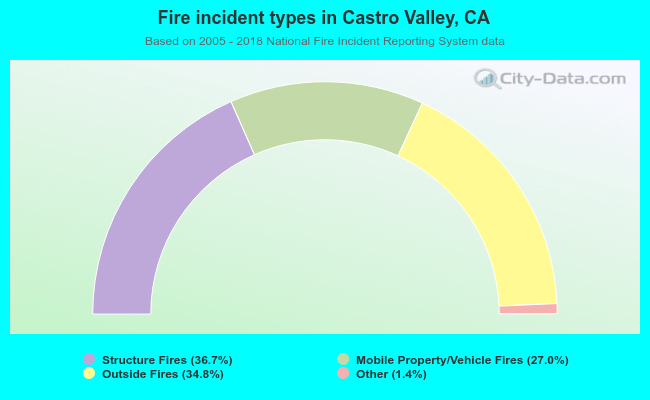 When looking into fire subcategories, the most incidents belonged to: Structure Fires (36.7%), and Outside Fires (34.8%).