Moraga: Fire Incidents, California (CA)
Where are fire incidents reported in Moraga, CA
Something went wrong! Please refresh the page.
|
| |||||||||||||||||||||||||||||||||||||||||||||||||||||||||||||||||||||||||||||||||||||||||||||||||||||||||||||
2002 - 2018 National Fire Incident Reporting System (NFIRS) incidents
- Incident types reported to NFIRS in Moraga, CA
- 4,04566.8%Rescue & EMS
- 72912.0%Good Intent Call
- 5338.8%False Alarm
- 4126.8%Service Call
- 1933.2%Fire
- 1372.3%Hazardous Condition
- Fire incident types reported to NFIRS in Moraga, CA
- 9850.8%Structure Fires
- 7940.9%Outside Fires
- 105.2%Mobile Property/Vehicle Fires
- 63.1%Other
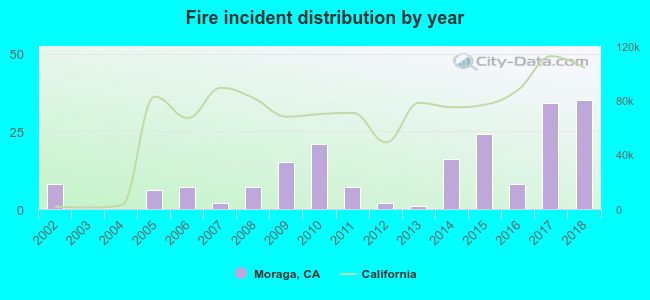 According to the data from the years 2002 - 2018 the average number of fires per year is 11. The highest number of fire incidents - 35 took place in 2018, and the least - 0 in 2003. The data has a rising trend.
The average number of yearly fire incidents per 10k residents in Moraga, CA compared to nearest cities:
(Note: Based on data for the last 3 years, including only cities with population 5,000 and above)
| Moraga: | 14.9 |
| Lafayette: | 18.8 |
| Orinda: | 26.1 |
| Alamo: | 12.1 |
| Piedmont: | 10.7 |
| Walnut Creek: | 13.3 |
| Oakland: | 37.6 |
| Pleasant Hill: | 25.1 |
| Berkeley: | 22.9 |

 32.6% incidents where reported in the morning and 67.4% in the evening. The most fires (18.7%) took place on Monday, and the least (11.4%) on Thursday.
 Based on the 193 fire incidents from years 2002 - 2018 most fires (16.1%) took place during July, and the least (3.1%) in December.
 Out of all 6,057 cases reported during the years 2002 - 2018, the most belonged to the categories: Rescue & EMS (66.8%), Good Intent Call (12.0%), and False Alarm (8.8%).
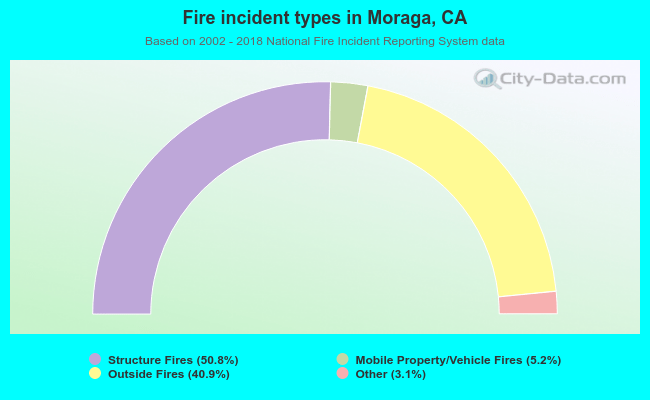 When looking into fire subcategories, the most incidents belonged to: Structure Fires (50.8%), and Outside Fires (40.9%).