Oxford: Fire Incidents, Mississippi (MS)
Where are fire incidents reported in Oxford, MS
Something went wrong! Please refresh the page.
| Fire incidents reported | |
|---|---|
| Sreet name | Count |
| HWY 6 WEST | 56 |
| HWY 334 | 50 |
| HWY 6 EAST | 36 |
| HWY 6 W | 32 |
| HWY 7 SOUTH | 32 |
| CR 101 | 30 |
| HWY 30 | 30 |
| JACKSON AVE | 30 |
| HWY 6 | 28 |
| CR 418 | 24 |
| CR 215 | 22 |
| CR 105 | 20 |
| HWY 314 | 20 |
| HWY 6 E | 20 |
| HWY 7 NORTH | 20 |
| MOLLY BARR ROAD | 20 |
| CR 102 | 18 |
| CR 149 | 18 |
| CR 166 | 18 |
| HWY 30 EAST | 18 |
| HWY 7 | 18 |
| 334 HWY | 16 |
| CR 313 | 16 |
| HWY 328 | 16 |
| 6 HWY | 14 |
| CR 403 | 14 |
| KROGER PARKING LOT | 14 |
| 2301 SOUTH LAMAR | 12 |
| CR 106 | 12 |
| CR 244 | 12 |
| Other | 2,844 |
2002 - 2018 National Fire Incident Reporting System (NFIRS) incidents
- Incident types reported to NFIRS in Oxford, MS
- 3,53037.1%Fire
- 2,22123.3%False Alarm
- 1,38614.6%Hazardous Condition
- 1,17712.4%Good Intent Call
- 7998.4%Rescue & EMS
- 3723.9%Service Call
- 190.2%Overpressure Rupture
- 160.2%Severe Weather
- Fire incident types reported to NFIRS in Oxford, MS
- 1,60845.6%Outside Fires
- 1,24835.4%Structure Fires
- 63317.9%Mobile Property/Vehicle Fires
- 411.2%Other
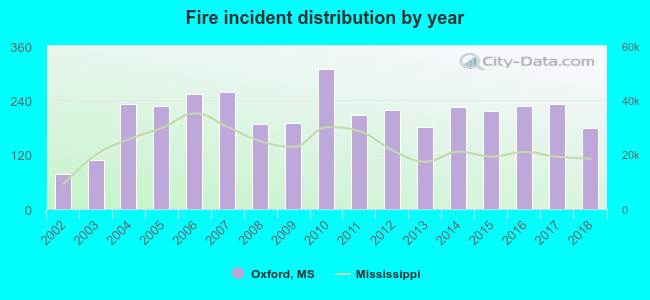 According to the data from the years 2002 - 2018 the average number of fires per year is 208. The highest number of fires - 309 took place in 2010, and the least - 78 in 2002. The data has a growing trend.
The average number of yearly fire incidents per 10k residents in Oxford, MS compared to nearest cities:
(Note: Based on data for the last 3 years, including only cities with population 5,000 and above)
| Oxford: | 98.1 |
| Batesville: | 247.3 |
| Holly Springs: | 220.9 |
| Pontotoc: | 260.7 |
| New Albany: | 165.4 |
| Senatobia: | 158.1 |
| Ripley: | 177.6 |
| Hernando: | 104.2 |
| Grenada: | 133.0 |
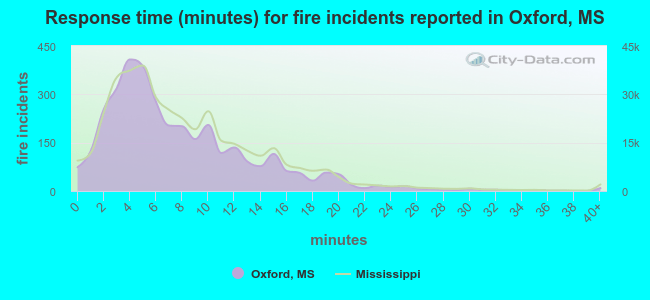 The median response time based on all reported fire incidents is 6 minutes. This is similar to the Mississippi median value.
The median response time in Oxford, MS compared to nearest cities:
(Note: Based on data for all years, including only cities with at least 500 fire incidents)
| Oxford: | 6 minutes |
| Water Valley: | 7 minutes |
| Sardis: | 10 minutes |
| Batesville: | 10 minutes |
| Courtland: | 12 minutes |
| Pope: | 12 minutes |
| Como: | 12 minutes |
| Myrtle: | 8 minutes |
| Bruce: | 10 minutes |
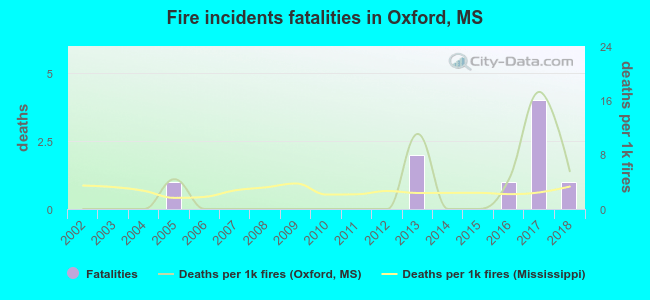 Based on the data from the years 2002 - 2018 the average number of fire-related fatalities per year is 1. The highest number of reported deaths - 4 took place in 2017, and the lowest - 0 in 2002. The data has an increasing trend.
The average number of deaths per 1,000 fires is 3. This indicator was the highest - 17 in 2017, and the lowest 0 in 2002. The trend for fatalities per 1,000 fire incidents is rising. Compared to the Mississippi value the number of fatalities per 1,000 fires is similar.
Based on the data from the years 2002 - 2018 the average number of fire-related fatalities per year is 1. The highest number of reported deaths - 4 took place in 2017, and the lowest - 0 in 2002. The data has an increasing trend.
The average number of deaths per 1,000 fires is 3. This indicator was the highest - 17 in 2017, and the lowest 0 in 2002. The trend for fatalities per 1,000 fire incidents is rising. Compared to the Mississippi value the number of fatalities per 1,000 fires is similar.Deaths per 1,000 incidents in Oxford, MS compared to nearest cities:
(Note: Based on data for all years, including only cities with at least 2,500 fire incidents)
| Oxford: | 2.5 |
| Batesville: | 2.7 |
| Holly Springs: | 1.5 |
| New Albany: | 0.8 |
| Byhalia: | 1.4 |
| Hernando: | 2.1 |
| Grenada: | 6.5 |
| Olive Branch: | 1.4 |
| Tupelo: | 2.8 |
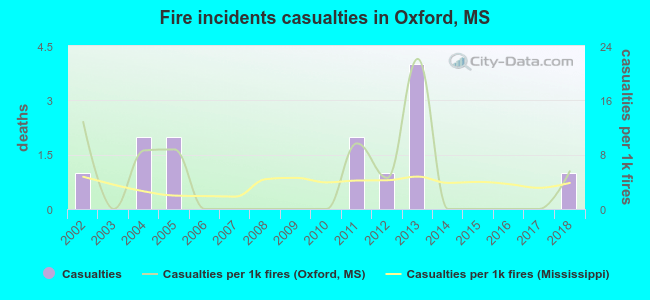 Based on the reports from the years 2002 - 2018 the average number of fire-related yearly casualties is 1. The highest number of casualties - 4 took place in 2013, and the lowest - 0 in 2003. The data has a constant trend.
The average number of casualties per 1,000 fire incidents is 4. This indicator was the highest - 22 in 2013, and the lowest 0 in 2003. The trend for casualties per 1,000 fire incidents is decreasing. Compared to the Mississippi value the number of casualties per 1,000 fire incidents is about the same.
Based on the reports from the years 2002 - 2018 the average number of fire-related yearly casualties is 1. The highest number of casualties - 4 took place in 2013, and the lowest - 0 in 2003. The data has a constant trend.
The average number of casualties per 1,000 fire incidents is 4. This indicator was the highest - 22 in 2013, and the lowest 0 in 2003. The trend for casualties per 1,000 fire incidents is decreasing. Compared to the Mississippi value the number of casualties per 1,000 fire incidents is about the same.Casualties per 1,000 incidents in Oxford, MS compared to nearest cities:
(Note: Based on data for all years, including only cities with at least 500 fire incidents)
| Oxford: | 3.7 |
| Water Valley: | 3.0 |
| Sardis: | 1.4 |
| Batesville: | 2.7 |
| Courtland: | 1.4 |
| Pope: | 0.0 |
| Como: | 0.0 |
| Myrtle: | 0.0 |
| Bruce: | 0.0 |
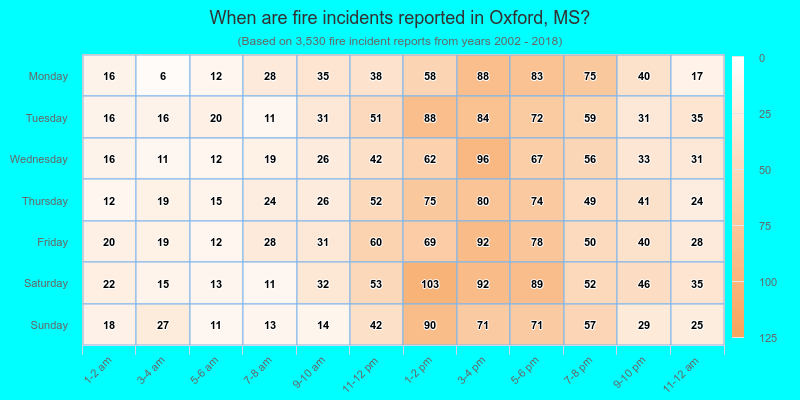
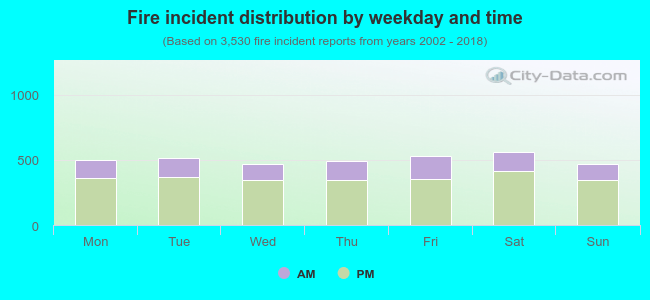 28.2% incidents where reported in the morning and 71.8% in the evening. The most fires (15.9%) took place on Saturday, and the least (13.3%) on Sunday.
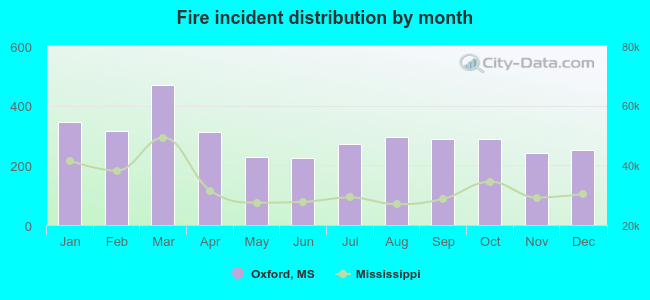 According to the 3,530 reports from years 2002 - 2018 most fires (13.3%) took place during March, and the least (6.4%) in June.
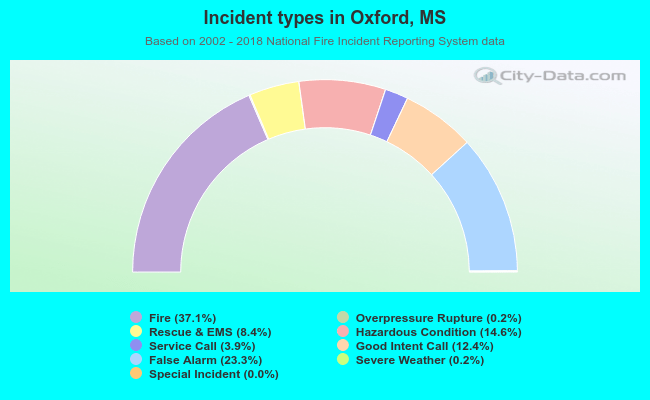 Out of all 9,523 cases reported during the years 2002 - 2018, the most belonged to the categories: Fire (37.1%), False Alarm (23.3%), and Hazardous Condition (14.6%).
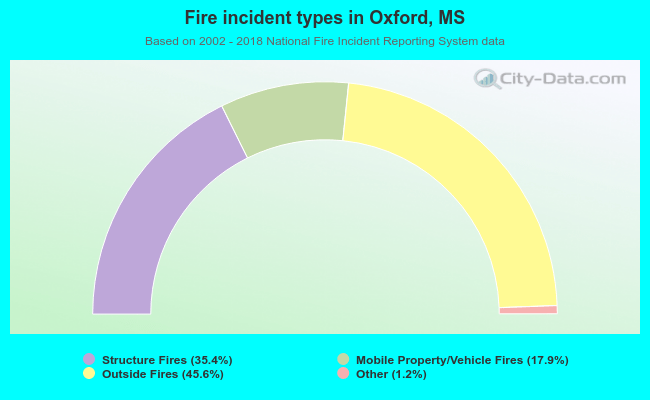 When looking into fire subcategories, the most incidents belonged to: Outside Fires (45.6%), and Structure Fires (35.4%).