Tupelo: Fire Incidents, Mississippi (MS)
Where are fire incidents reported in Tupelo, MS
Something went wrong! Please refresh the page.
| Fire incidents reported | |
|---|---|
| Sreet name | Count |
| MAIN ST | 384 |
| GLOSTER ST | 344 |
| GREEN ST | 212 |
| GLOSTER | 208 |
| MCCULLOUGH BLVD | 112 |
| IDA ST | 96 |
| HWY 45 | 94 |
| EASON BLVD | 86 |
| LAWNDALE DR | 84 |
| 931 RD | 74 |
| HWY 78 | 68 |
| BARNES CROSSING RD | 62 |
| JACKSON ST | 58 |
| MAIN | 58 |
| 1498 RD | 56 |
| GREEN | 56 |
| 1349 RD | 54 |
| 1562 RD | 52 |
| CHURCH ST | 48 |
| GREEN TEE RD | 48 |
| 78 HWY | 46 |
| COLEY RD | 44 |
| BARLEY COURT | 42 |
| BARNES CROSSING | 42 |
| MCCULLOUGH | 40 |
| 178 HWY | 38 |
| 45 HWY | 38 |
| SPRING ST | 36 |
| CLIFF GOOKIN | 34 |
| MADISON | 34 |
| Other | 1,966 |
2002 - 2018 National Fire Incident Reporting System (NFIRS) incidents
- Incident types reported to NFIRS in Tupelo, MS
- 13,36455.2%Rescue & EMS
- 4,61419.1%Fire
- 2,1218.8%False Alarm
- 1,6947.0%Hazardous Condition
- 1,4496.0%Good Intent Call
- 8923.7%Service Call
- 400.2%Overpressure Rupture
- Fire incident types reported to NFIRS in Tupelo, MS
- 1,97842.9%Outside Fires
- 1,56934.0%Structure Fires
- 83018.0%Mobile Property/Vehicle Fires
- 2375.1%Other
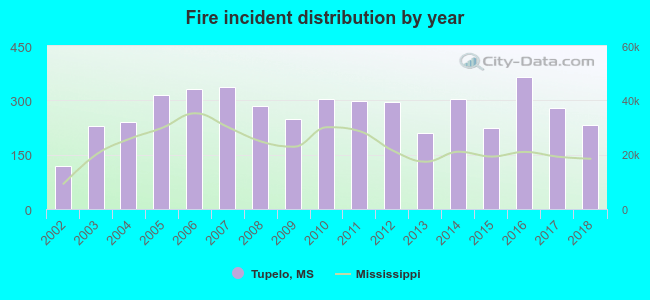 Based on the data from the years 2002 - 2018 the average number of fires per year is 271. The highest number of fires - 365 took place in 2016, and the least - 119 in 2002. The data has an increasing trend.
The average number of yearly fire incidents per 10k residents in Tupelo, MS compared to nearest cities:
(Note: Based on data for the last 3 years, including only cities with population 5,000 and above)
| Tupelo: | 81.8 |
| Saltillo: | 171.9 |
| Pontotoc: | 260.7 |
| New Albany: | 165.4 |
| Amory: | 111.2 |
| Booneville: | 373.3 |
| Aberdeen: | 182.3 |
| Ripley: | 177.6 |
| West Point: | 91.0 |
 The median response time based on all reported fire incidents is 5 minutes. This is lower compared to the Mississippi median value.
The median response time in Tupelo, MS compared to nearest cities:
(Note: Based on data for all years, including only cities with at least 500 fire incidents)
| Tupelo: | 5 minutes |
| Verona: | 5 minutes |
| Saltillo: | 8 minutes |
| Shannon: | 8 minutes |
| Blue Springs: | 9 minutes |
| Nettleton: | 9 minutes |
| Guntown: | 9 minutes |
| Mantachie: | 7 minutes |
| Pontotoc: | 9 minutes |
 According to the reports from the years 2002 - 2018 the average number of fire-related yearly deaths is 1. The highest number of deaths - 5 took place in 2016, and the lowest - 0 in 2003. The data has a decreasing trend.
The average number of deaths per 1,000 fire incidents is 3. This indicator was the highest - 14 in 2016, and the lowest 0 in 2003. The trend for deaths per 1,000 fire incidents is declining. Compared to the Mississippi value the number of fatalities per 1,000 fire incidents is similar.
According to the reports from the years 2002 - 2018 the average number of fire-related yearly deaths is 1. The highest number of deaths - 5 took place in 2016, and the lowest - 0 in 2003. The data has a decreasing trend.
The average number of deaths per 1,000 fire incidents is 3. This indicator was the highest - 14 in 2016, and the lowest 0 in 2003. The trend for deaths per 1,000 fire incidents is declining. Compared to the Mississippi value the number of fatalities per 1,000 fire incidents is similar.Deaths per 1,000 incidents in Tupelo, MS compared to nearest cities:
(Note: Based on data for all years, including only cities with at least 2,500 fire incidents)
| Tupelo: | 2.8 |
| New Albany: | 0.8 |
| Booneville: | 2.5 |
| Oxford: | 2.5 |
| Corinth: | 2.0 |
 Based on the data from the years 2002 - 2018 the average number of fire-related yearly casualties is 1. The highest number of reported injuries - 3 took place in 2011, and the lowest - 0 in 2002. The data has a constant trend.
The average number of injuries per 1,000 fire incidents is 2. This indicator was the highest - 10 in 2011, and the lowest 0 in 2002. The trend for injuries per 1,000 fires is constant. Compared to the Mississippi value the number of casualties per 1,000 fires is lower.
Based on the data from the years 2002 - 2018 the average number of fire-related yearly casualties is 1. The highest number of reported injuries - 3 took place in 2011, and the lowest - 0 in 2002. The data has a constant trend.
The average number of injuries per 1,000 fire incidents is 2. This indicator was the highest - 10 in 2011, and the lowest 0 in 2002. The trend for injuries per 1,000 fires is constant. Compared to the Mississippi value the number of casualties per 1,000 fires is lower.
 29.6% incidents where reported in the morning and 70.4% in the evening. The most fires (16.4%) took place on Saturday, and the least (13.2%) on Tuesday.
 According to the 4,614 reports from years 2002 - 2018 most fires (10.7%) took place during March, and the least (7.0%) in November.
 Out of all 24,216 cases reported during the years 2002 - 2018, the most belonged to the categories: Rescue & EMS (55.2%), Fire (19.1%), and False Alarm (8.8%).
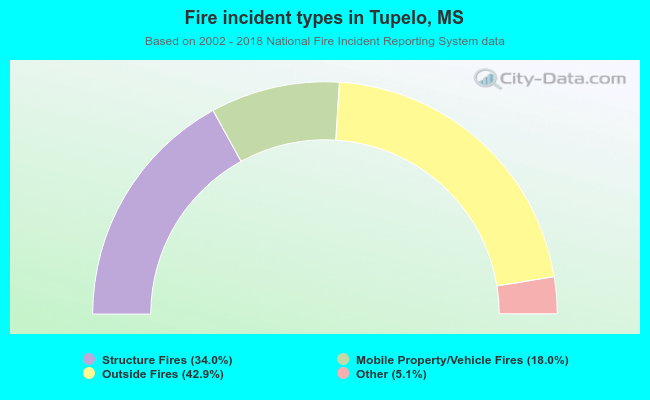 When looking into fire subcategories, the most reports belonged to: Outside Fires (42.9%), and Structure Fires (34.0%).