Olive Branch: Fire Incidents, Mississippi (MS)
Where are fire incidents reported in Olive Branch, MS
Something went wrong! Please refresh the page.
| Fire incidents reported | |
|---|---|
| Sreet name | Count |
| GOODMAN RD | 376 |
| HWY 78 HWY | 196 |
| HACKS CROSS RD | 162 |
| HWY 178 HWY | 162 |
| STATELINE RD | 156 |
| HIGHWAY 78 HWY | 132 |
| PLEASANT HILL RD | 100 |
| HWY 78 | 88 |
| POLK LN | 88 |
| BETHEL RD | 78 |
| HWY 302 HWY | 78 |
| SANDRIDGE RD | 76 |
| CRAFT RD | 68 |
| HIGHWAY 178 HWY | 62 |
| HWY 302 | 62 |
| NICHOLS BLVD | 58 |
| CAROMA ST | 56 |
| CRAFT GOODMAN FRONTAGE RD | 56 |
| HWY 305 HWY | 54 |
| COLLEGE RD | 52 |
| RED BANKS RD | 52 |
| HWY 178 | 50 |
| BYHALIA RD | 46 |
| HIGHWAY 305 HWY | 44 |
| BLOCKER ST | 40 |
| CENTER HILL RD | 40 |
| CENTERHILL RD | 38 |
| DAVIDSON RD | 34 |
| GERMANTOWN RD | 34 |
| ALEXANDER RD | 32 |
| Other | 964 |
2002 - 2018 National Fire Incident Reporting System (NFIRS) incidents
- Incident types reported to NFIRS in Olive Branch, MS
- 15,53759.9%Rescue & EMS
- 3,53413.6%Fire
- 2,60510.0%Hazardous Condition
- 2,5719.9%False Alarm
- 1,1224.3%Service Call
- 5202.0%Good Intent Call
- 340.1%Severe Weather
- Fire incident types reported to NFIRS in Olive Branch, MS
- 1,60445.4%Outside Fires
- 1,27836.2%Structure Fires
- 59516.8%Mobile Property/Vehicle Fires
- 571.6%Other
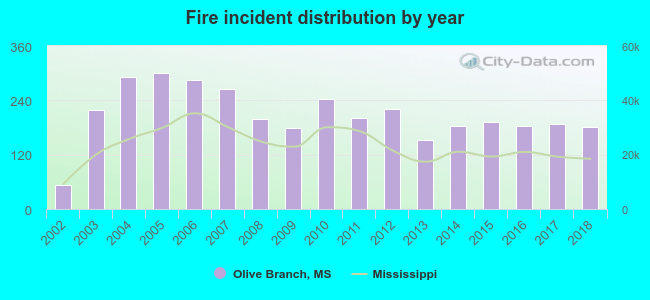 According to the data from the years 2002 - 2018 the average number of fires per year is 208. The highest number of fires - 300 took place in 2005, and the least - 53 in 2002. The data has a growing trend.
The average number of yearly fire incidents per 10k residents in Olive Branch, MS compared to nearest cities:
(Note: Based on data for the last 3 years, including only cities with population 5,000 and above)
| Olive Branch: | 52.0 |
| Southaven: | 30.0 |
| Horn Lake: | 37.9 |
| Hernando: | 104.2 |
| Senatobia: | 158.1 |
| Holly Springs: | 220.9 |
| Batesville: | 247.3 |
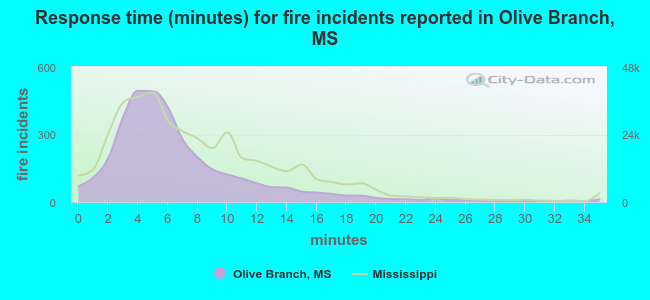 The median response time based on all reported fire incidents is 6 minutes. This is similar to the Mississippi median value.
The median response time in Olive Branch, MS compared to nearest cities:
(Note: Based on data for all years, including only cities with at least 500 fire incidents)
| Olive Branch: | 6 minutes |
| Southaven: | 5 minutes |
| Byhalia: | 12 minutes |
| Horn Lake: | 4 minutes |
| Hernando: | 8 minutes |
| Walls: | 8 minutes |
| Coldwater: | 10 minutes |
| West Memphis: | 5 minutes |
| Senatobia: | 7 minutes |
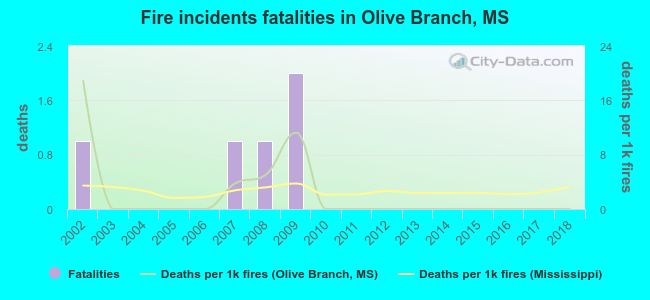 Based on the data from the years 2002 - 2018 the average number of fire-related fatalities per year is 0. The highest number of reported deaths - 2 took place in 2009, and the lowest - 0 in 2003. The data has a decreasing trend.
The average number of deaths per 1,000 fires is 2. This indicator was the highest - 19 in 2002, and the lowest 0 in 2003. The trend for fatalities per 1,000 fire incidents is declining. Compared to the Mississippi value the number of fatalities per 1,000 fires is lower.
Based on the data from the years 2002 - 2018 the average number of fire-related fatalities per year is 0. The highest number of reported deaths - 2 took place in 2009, and the lowest - 0 in 2003. The data has a decreasing trend.
The average number of deaths per 1,000 fires is 2. This indicator was the highest - 19 in 2002, and the lowest 0 in 2003. The trend for fatalities per 1,000 fire incidents is declining. Compared to the Mississippi value the number of fatalities per 1,000 fires is lower.Deaths per 1,000 incidents in Olive Branch, MS compared to nearest cities:
(Note: Based on data for all years, including only cities with at least 2,500 fire incidents)
| Olive Branch: | 1.4 |
| Southaven: | 3.5 |
| Byhalia: | 1.4 |
| Hernando: | 2.1 |
| West Memphis: | 2.6 |
| Holly Springs: | 1.5 |
| Batesville: | 2.7 |
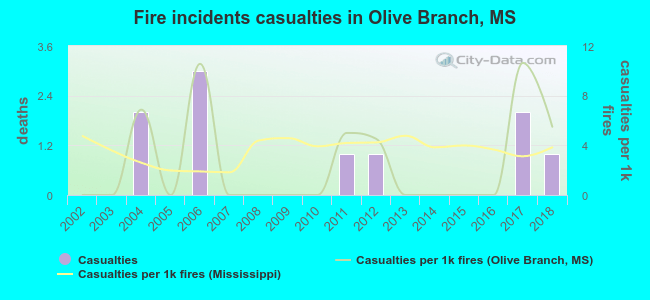 According to the data from the years 2002 - 2018 the average number of fire-related yearly casualties is 1. The highest number of casualties - 3 took place in 2006, and the lowest - 0 in 2002. The data has a growing trend.
The average number of casualties per 1,000 fire incidents is 3. This indicator was the highest - 11 in 2017, and the lowest 0 in 2002. The trend for casualties per 1,000 fire incidents is increasing. Compared to the Mississippi value the number of casualties per 1,000 fire incidents is lower.
According to the data from the years 2002 - 2018 the average number of fire-related yearly casualties is 1. The highest number of casualties - 3 took place in 2006, and the lowest - 0 in 2002. The data has a growing trend.
The average number of casualties per 1,000 fire incidents is 3. This indicator was the highest - 11 in 2017, and the lowest 0 in 2002. The trend for casualties per 1,000 fire incidents is increasing. Compared to the Mississippi value the number of casualties per 1,000 fire incidents is lower.
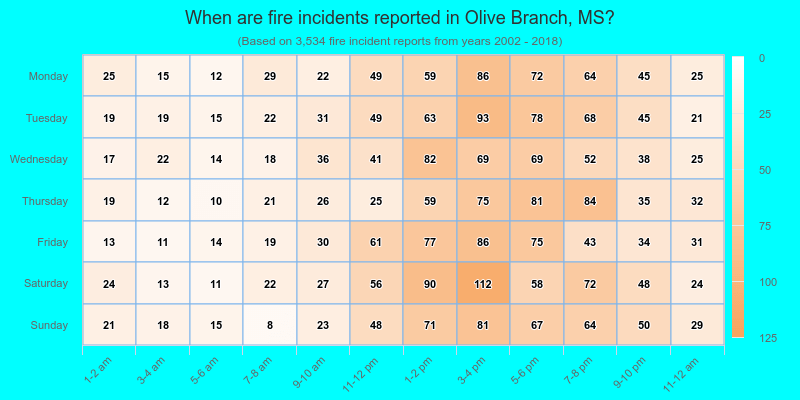
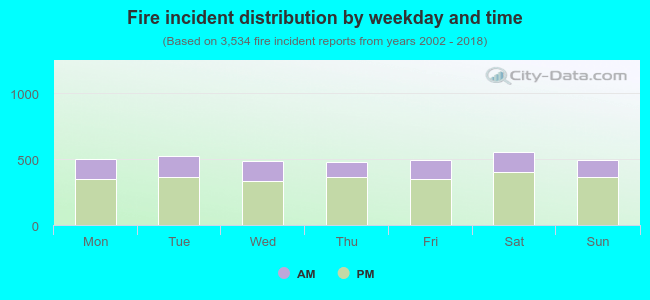 28.4% incidents where reported in the morning and 71.6% in the evening. The most fires (15.8%) took place on Saturday, and the least (13.6%) on Thursday.
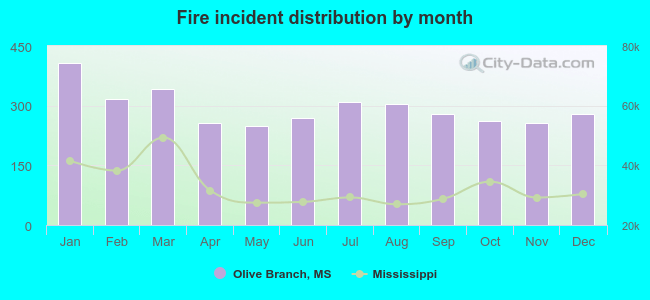 Based on the 3,534 fire incidents from years 2002 - 2018 most fires (11.5%) took place during January, and the least (7.1%) in May.
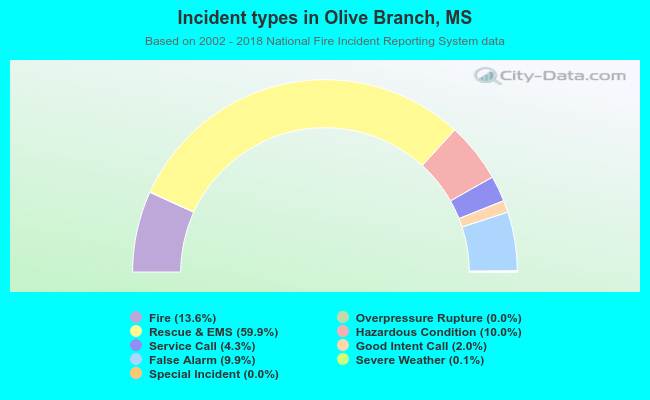 Out of all 25,938 cases reported during the years 2002 - 2018, the most belonged to the categories: Rescue & EMS (59.9%), Fire (13.6%), and Hazardous Condition (10.0%).
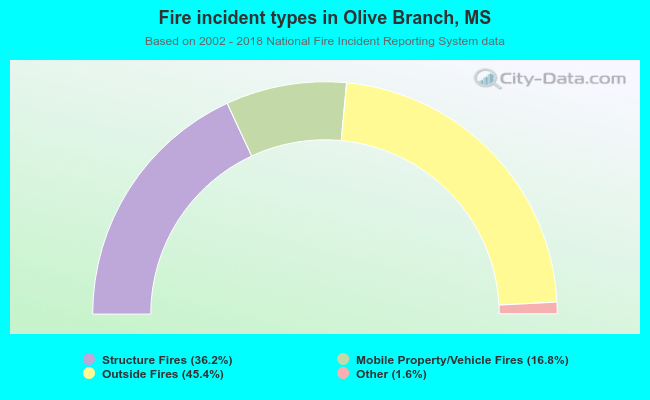 When looking into fire subcategories, the most reports belonged to: Outside Fires (45.4%), and Structure Fires (36.2%).