West Memphis: Fire Incidents, Arkansas (AR)
Where are fire incidents reported in West Memphis, AR
Something went wrong! Please refresh the page.
| Fire incidents reported | |
|---|---|
| Sreet name | Count |
| BROADWAY | 290 |
| JACKSON | 288 |
| SERVICE RD | 226 |
| AVALON | 210 |
| JACKSON ST | 184 |
| AVALON ST | 148 |
| BROADWAY ST | 126 |
| I40 | 110 |
| MCAULEY | 106 |
| BARTON | 86 |
| AUTUMN | 82 |
| INGRAM BLVD | 76 |
| STUART | 74 |
| MISSOURI | 66 |
| TYLER | 60 |
| 14TH ST | 58 |
| MISSOURI ST | 54 |
| GROVE | 52 |
| BEATTY | 50 |
| I55 | 50 |
| SERVICE RD | 50 |
| GOODWIN | 46 |
| ROSELAWN ST | 46 |
| 16TH ST | 44 |
| I-40 | 44 |
| INGRAM | 44 |
| THOMPSON | 44 |
| 18TH ST | 42 |
| MOUND CITY RD | 42 |
| 10TH ST | 40 |
| Other | 1,437 |
2002 - 2018 National Fire Incident Reporting System (NFIRS) incidents
- Incident types reported to NFIRS in West Memphis, AR
- 4,27538.2%Fire
- 3,72433.3%Rescue & EMS
- 1,57214.1%Hazardous Condition
- 7386.6%False Alarm
- 4223.8%Good Intent Call
- 3423.1%Service Call
- 930.8%Overpressure Rupture
- Fire incident types reported to NFIRS in West Memphis, AR
- 1,92044.9%Structure Fires
- 1,39732.7%Outside Fires
- 84419.7%Mobile Property/Vehicle Fires
- 1142.7%Other
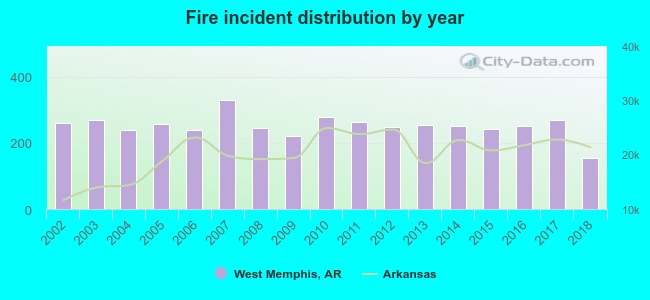 According to the data from the years 2002 - 2018 the average number of fires per year is 251. The highest number of reported fire incidents - 329 took place in 2007, and the least - 154 in 2018. The data has a dropping trend.
The average number of yearly fire incidents per 10k residents in West Memphis, AR compared to nearest cities:
(Note: Based on data for the last 3 years, including only cities with population 5,000 and above)
| West Memphis: | 88.5 |
| Marion: | 83.3 |
| Wynne: | 121.5 |
| Forrest City: | 64.1 |
| Osceola: | 81.5 |
| Trumann: | 173.6 |
 The median response time based on all reported fire incidents is 5 minutes. This is lower compared to the state median value.
The median response time in West Memphis, AR compared to nearest cities:
(Note: Based on data for all years, including only cities with at least 500 fire incidents)
| West Memphis: | 5 minutes |
| Marion: | 7 minutes |
| Earle: | 5 minutes |
| Hughes: | 5 minutes |
| Marked Tree: | 6 minutes |
| Wynne: | 4 minutes |
| Forrest City: | 4 minutes |
| Osceola: | 3 minutes |
| Trumann: | 3 minutes |
 According to the reports from the years 2002 - 2018 the average number of fire-related fatalities per year is 1. The highest number of deaths - 3 took place in 2002, and the lowest - 0 in 2004. The data has a declining trend.
The average number of fatalities per 1,000 fires is 2. This indicator was the highest - 12 in 2005, and the lowest 0 in 2004. The trend for fatalities per 1,000 fire incidents is dropping. Compared to the state value the number of fatalities per 1,000 fire incidents is about the same.
According to the reports from the years 2002 - 2018 the average number of fire-related fatalities per year is 1. The highest number of deaths - 3 took place in 2002, and the lowest - 0 in 2004. The data has a declining trend.
The average number of fatalities per 1,000 fires is 2. This indicator was the highest - 12 in 2005, and the lowest 0 in 2004. The trend for fatalities per 1,000 fire incidents is dropping. Compared to the state value the number of fatalities per 1,000 fire incidents is about the same.Deaths per 1,000 incidents in West Memphis, AR compared to nearest cities:
(Note: Based on data for all years, including only cities with at least 2,500 fire incidents)
| West Memphis: | 2.6 |
 According to the data from the years 2002 - 2018 the average number of fire-related yearly casualties is 2. The highest number of reported injuries - 10 took place in 2014, and the lowest - 0 in 2011. The data has a declining trend.
The average number of injuries per 1,000 fires is 8. This indicator was the highest - 40 in 2014, and the lowest 0 in 2011. The trend for casualties per 1,000 fire incidents is dropping. Compared to the state value the number of casualties per 1,000 fires is higher.
According to the data from the years 2002 - 2018 the average number of fire-related yearly casualties is 2. The highest number of reported injuries - 10 took place in 2014, and the lowest - 0 in 2011. The data has a declining trend.
The average number of injuries per 1,000 fires is 8. This indicator was the highest - 40 in 2014, and the lowest 0 in 2011. The trend for casualties per 1,000 fire incidents is dropping. Compared to the state value the number of casualties per 1,000 fires is higher.Casualties per 1,000 incidents in West Memphis, AR compared to nearest cities:
(Note: Based on data for all years, including only cities with at least 500 fire incidents)
| West Memphis: | 8.2 |
| Marion: | 0.0 |
| Earle: | 1.3 |
| Hughes: | 0.0 |
| Marked Tree: | 5.1 |
| Wynne: | 1.7 |
| Forrest City: | 7.5 |
| Osceola: | 1.5 |
| Trumann: | 0.5 |
 35.9% incidents where reported in the morning and 64.1% in the evening. The most fires (15.1%) took place on Saturday, and the least (13.6%) on Wednesday.
 According to the 4,275 fire incidents from years 2002 - 2018 most fires (13.1%) took place during July, and the least (6.5%) in November.
 Out of all 11,181 cases reported during the years 2002 - 2018, the most belonged to the categories: Fire (38.2%), Rescue & EMS (33.3%), and Hazardous Condition (14.1%).
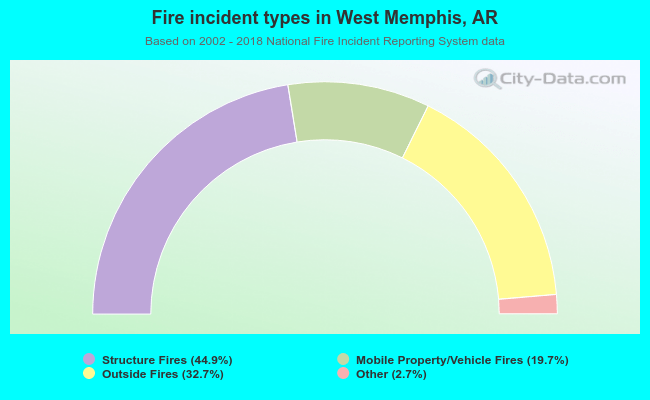 When looking into fire subcategories, the most incidents belonged to: Structure Fires (44.9%), and Outside Fires (32.7%).