Novato: Fire Incidents, California (CA)
Where are fire incidents reported in Novato, CA
Something went wrong! Please refresh the page.
| Fire incidents reported | |
|---|---|
| Sreet name | Count |
| NOVATO BLVD | 88 |
| REDWOOD BLVD | 52 |
| 101 HWY | 38 |
| SAN MARIN DR | 34 |
| ALAMEDA DEL PRADO | 32 |
| GRANT AVE | 30 |
| HWY 101 | 30 |
| IGNACIO BLVD | 26 |
| VINTAGE WAY | 24 |
| MARIN VALLEY DR | 22 |
| FAIRWAY DR | 20 |
| MARION AVE | 20 |
| NAVE DR | 20 |
| WILSON AVE | 20 |
| ARMSTRONG AVE | 18 |
| CENTER RD | 18 |
| HILL RD | 18 |
| 7TH ST | 16 |
| ATHERTON AVE | 16 |
| WOOD HOLLOW DR | 16 |
| BEL MARIN KEYS BLVD | 14 |
| HAMILTON PKY | 14 |
| POSADA DEL SOL | 14 |
| REDWOOD BL | 14 |
| ROWLAND WAY | 14 |
| ARTHUR ST | 12 |
| CHASE ST | 12 |
| DIABLO AVE | 12 |
| NOVATO | 12 |
| REDWOOD HWY | 12 |
| Other | 273 |
2002 - 2018 National Fire Incident Reporting System (NFIRS) incidents
- Incident types reported to NFIRS in Novato, CA
- 11,37163.5%Rescue & EMS
- 2,11611.8%Service Call
- 1,6859.4%Good Intent Call
- 1,1186.2%False Alarm
- 9615.4%Fire
- 5553.1%Hazardous Condition
- 690.4%Severe Weather
- 260.1%Special Incident
- 190.1%Overpressure Rupture
- Fire incident types reported to NFIRS in Novato, CA
- 44746.5%Outside Fires
- 32133.4%Structure Fires
- 12412.9%Mobile Property/Vehicle Fires
- 697.2%Other
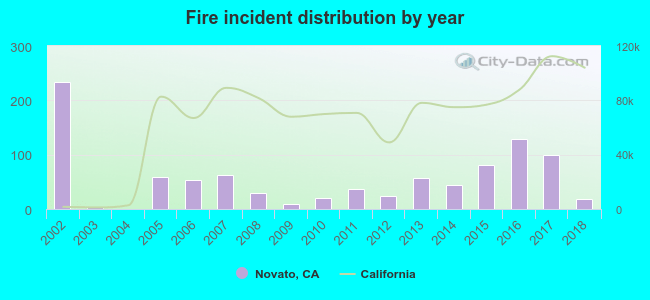 According to the data from the years 2002 - 2018 the average number of fires per year is 57. The highest number of reported fires - 234 took place in 2002, and the least - 0 in 2004. The data has a declining trend.
The average number of yearly fire incidents per 10k residents in Novato, CA compared to nearest cities:
(Note: Based on data for the last 3 years, including only cities with population 5,000 and above)
| Novato: | 15.0 |
| Fairfax: | 24.4 |
| San Anselmo: | 18.7 |
| San Rafael: | 28.9 |
| Kentfield: | 29.3 |
| Larkspur: | 14.9 |
| Petaluma: | 19.7 |
| Corte Madera: | 29.2 |
| Mill Valley: | 43.0 |
 The median response time based on all reported fire incidents is 6 minutes. This is similar to the state median value.
The median response time in Novato, CA compared to nearest cities:
(Note: Based on data for all years, including only cities with at least 500 fire incidents)
| Novato: | 6 minutes |
| San Rafael: | 5 minutes |
| Petaluma: | 7 minutes |
| Mill Valley: | 6 minutes |
| Sonoma: | 8 minutes |
| San Pablo: | 7 minutes |
| Richmond: | 7 minutes |
| Sausalito: | 6 minutes |
| Rodeo: | 6 minutes |
 According to the reports from the years 2002 - 2018 the average number of fire-related yearly casualties is 1. The highest number of casualties - 7 took place in 2002, and the lowest - 0 in 2003. The data has a dropping trend.
The average number of injuries per 1,000 fire incidents is 13. This indicator was the highest - 42 in 2012, and the lowest 0 in 2003. The trend for injuries per 1,000 fires is dropping. Compared to the state value the number of casualties per 1,000 fire incidents is much higher.
According to the reports from the years 2002 - 2018 the average number of fire-related yearly casualties is 1. The highest number of casualties - 7 took place in 2002, and the lowest - 0 in 2003. The data has a dropping trend.
The average number of injuries per 1,000 fire incidents is 13. This indicator was the highest - 42 in 2012, and the lowest 0 in 2003. The trend for injuries per 1,000 fires is dropping. Compared to the state value the number of casualties per 1,000 fire incidents is much higher.Casualties per 1,000 incidents in Novato, CA compared to nearest cities:
(Note: Based on data for all years, including only cities with at least 500 fire incidents)
| Novato: | 17.7 |
| San Rafael: | 3.1 |
| Petaluma: | 6.6 |
| Mill Valley: | 2.6 |
| Sonoma: | 2.9 |
| San Pablo: | 1.9 |
| Richmond: | 4.0 |
| Sausalito: | 5.5 |
| Rodeo: | 1.4 |
 26.5% incidents where reported in the morning and 73.5% in the evening. The most fires (16.5%) took place on Sunday, and the least (12.8%) on Monday.
 Based on the 961 reports from years 2002 - 2018 most fires (13.7%) took place during July, and the least (4.2%) in February.
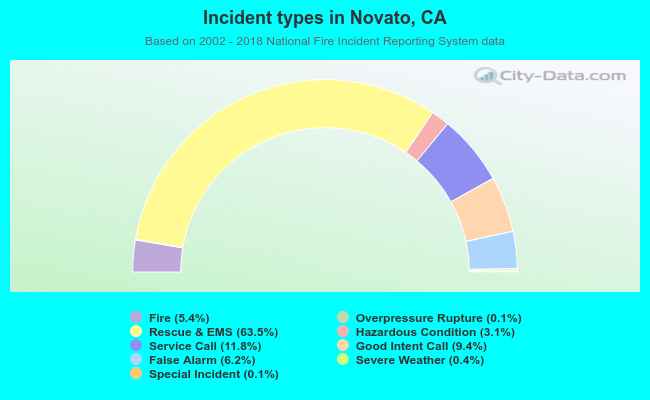 Out of all 17,920 cases reported during the years 2002 - 2018, the most belonged to the categories: Rescue & EMS (63.5%), Service Call (11.8%), and Good Intent Call (9.4%).
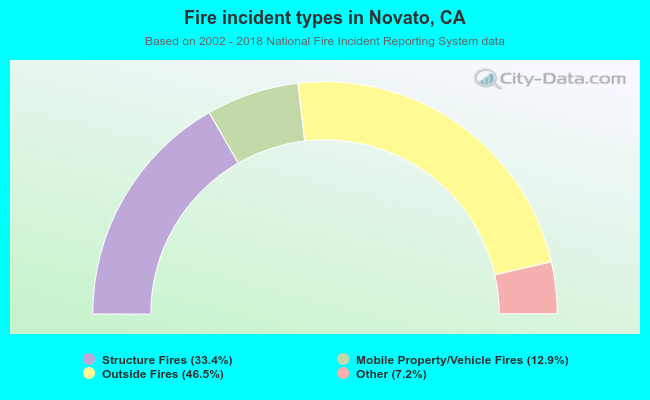 When looking into fire subcategories, the most reports belonged to: Outside Fires (46.5%), and Structure Fires (33.4%).