Petaluma: Fire Incidents, California (CA)
Where are fire incidents reported in Petaluma, CA
Something went wrong! Please refresh the page.
| Fire incidents reported | |
|---|---|
| Sreet name | Count |
| MCDOWELL BLVD | 186 |
| PETALUMA BLVD | 148 |
| SONOMA MOUNTAIN PKWY | 120 |
| LAKEVILLE HWY | 114 |
| WASHINGTON ST | 102 |
| US 101 HWY. | 78 |
| 101 HWY | 70 |
| STONY POINT RD | 66 |
| BODEGA AVE | 60 |
| HWY 101 | 60 |
| ADOBE RD | 58 |
| CASA GRANDE RD | 54 |
| CHILENO VALLEY RD | 50 |
| LAKEVILLE HW | 48 |
| SPRING HILL RD | 48 |
| MEACHAM RD | 46 |
| PEPPER RD | 46 |
| D ST | 44 |
| SKILLMAN LN | 44 |
| STAGE GULCH RD | 42 |
| THOMPSON LN | 40 |
| HWY 37 | 38 |
| LIBERTY RD | 38 |
| MIDDLE TWO ROCK RD | 36 |
| THOMPSON LANE | 36 |
| B ST | 34 |
| LAKEVILLE ST | 34 |
| MARIA DR | 34 |
| BODEGA AV | 30 |
| WESTERN AVE | 30 |
| Other | 302 |
2005 - 2018 National Fire Incident Reporting System (NFIRS) incidents
- Incident types reported to NFIRS in Petaluma, CA
- 5,63846.7%Rescue & EMS
- 2,13617.7%Fire
- 1,48712.3%Good Intent Call
- 1,0318.5%Hazardous Condition
- 1,0228.5%Service Call
- 6165.1%False Alarm
- 1151.0%Special Incident
- 170.1%Overpressure Rupture
- Fire incident types reported to NFIRS in Petaluma, CA
- 1,12152.5%Outside Fires
- 66931.3%Structure Fires
- 28513.3%Mobile Property/Vehicle Fires
- 612.9%Other
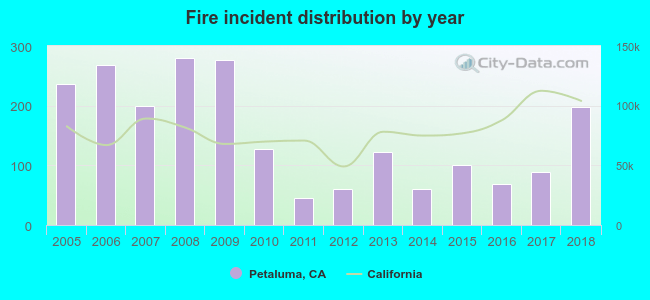 Based on the data from the years 2005 - 2018 the average number of fire incidents per year is 152. The highest number of fire incidents - 280 took place in 2008, and the least - 46 in 2011. The data has a declining trend.
The average number of yearly fire incidents per 10k residents in Petaluma, CA compared to nearest cities:
(Note: Based on data for the last 3 years, including only cities with population 5,000 and above)
| Petaluma: | 19.7 |
| Cotati: | 39.0 |
| Rohnert Park: | 6.6 |
| Boyes Hot Springs: | 3.0 |
| Sonoma: | 91.7 |
| Novato: | 15.0 |
| Roseland: | 18.2 |
| Santa Rosa: | 17.5 |
| Sebastopol: | 88.3 |
 The median response time based on all reported fire incidents is 7 minutes. This is about the same as the California median value.
The median response time in Petaluma, CA compared to nearest cities:
(Note: Based on data for all years, including only cities with at least 500 fire incidents)
| Petaluma: | 7 minutes |
| Cotati: | 6 minutes |
| Sonoma: | 8 minutes |
| Novato: | 6 minutes |
| Santa Rosa: | 6 minutes |
| Sebastopol: | 9 minutes |
| Napa: | 6 minutes |
| San Rafael: | 5 minutes |
| American Canyon: | 5 minutes |
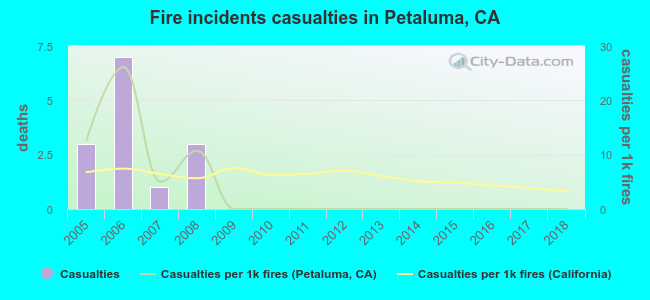 According to the data from the years 2005 - 2018 the average number of fire-related casualties per year is 1. The highest number of injuries - 7 took place in 2006, and the lowest - 0 in 2009. The data has a decreasing trend.
The average number of injuries per 1,000 fire incidents is 4. This indicator was the highest - 26 in 2006, and the lowest 0 in 2009. The trend for injuries per 1,000 fire incidents is decreasing. Compared to the California value the number of injuries per 1,000 fires is about the same.
According to the data from the years 2005 - 2018 the average number of fire-related casualties per year is 1. The highest number of injuries - 7 took place in 2006, and the lowest - 0 in 2009. The data has a decreasing trend.
The average number of injuries per 1,000 fire incidents is 4. This indicator was the highest - 26 in 2006, and the lowest 0 in 2009. The trend for injuries per 1,000 fire incidents is decreasing. Compared to the California value the number of injuries per 1,000 fires is about the same.Casualties per 1,000 incidents in Petaluma, CA compared to nearest cities:
(Note: Based on data for all years, including only cities with at least 500 fire incidents)
| Petaluma: | 6.6 |
| Cotati: | 6.9 |
| Sonoma: | 2.9 |
| Novato: | 17.7 |
| Santa Rosa: | 14.9 |
| Sebastopol: | 0.0 |
| Napa: | 9.9 |
| San Rafael: | 3.1 |
| American Canyon: | 1.7 |
 27.2% incidents where reported in the morning and 72.8% in the evening. The most fires (14.8%) took place on Wednesday, and the least (13.8%) on Monday.
 Based on the 2,136 fires from years 2005 - 2018 most fires (14.6%) took place during July, and the least (5.2%) in February.
 Out of all 12,071 cases reported during the years 2005 - 2018, the most belonged to the categories: Rescue & EMS (46.7%), Fire (17.7%), and Good Intent Call (12.3%).
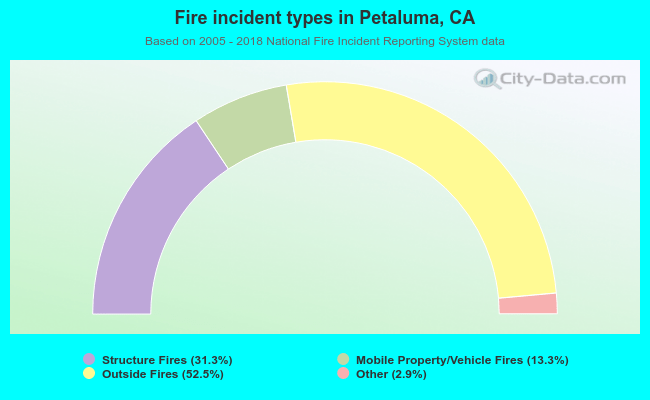 When looking into fire subcategories, the most reports belonged to: Outside Fires (52.5%), and Structure Fires (31.3%).