Sausalito: Fire Incidents, California (CA)
Where are fire incidents reported in Sausalito, CA
Something went wrong! Please refresh the page.
|
| |||||||||||||||||||||||||||||||||||||||||||||||||||||||||||||||||||||||||||||||||||||||||||||||||||||||||||||
2002 - 2018 National Fire Incident Reporting System (NFIRS) incidents
- Incident types reported to NFIRS in Sausalito, CA
- 3,83153.9%Rescue & EMS
- 96813.6%Good Intent Call
- 6829.6%Service Call
- 6178.7%False Alarm
- 5447.7%Fire
- 4185.9%Hazardous Condition
- 240.3%Severe Weather
- 140.2%Overpressure Rupture
- 110.2%Special Incident
- Fire incident types reported to NFIRS in Sausalito, CA
- 24845.6%Structure Fires
- 13925.6%Mobile Property/Vehicle Fires
- 11120.4%Outside Fires
- 468.5%Other
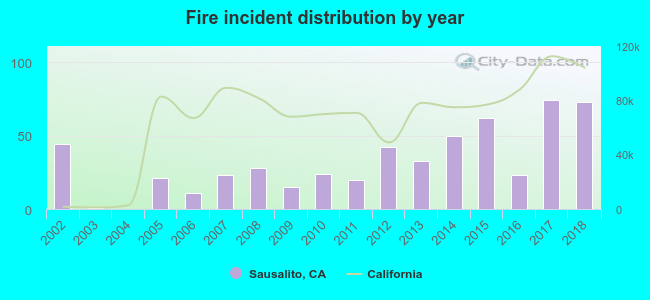 Based on the data from the years 2002 - 2018 the average number of fire incidents per year is 32. The highest number of fire incidents - 74 took place in 2017, and the least - 0 in 2004. The data has an increasing trend.
The average number of yearly fire incidents per 10k residents in Sausalito, CA compared to nearest cities:
(Note: Based on data for the last 3 years, including only cities with population 5,000 and above)
| Sausalito: | 79.4 |
| Tiburon: | 19.9 |
| Strawberry: | 6.2 |
| Mill Valley: | 43.0 |
| Corte Madera: | 29.2 |
| Larkspur: | 14.9 |
| Kentfield: | 29.3 |
| San Francisco: | 36.6 |
| San Rafael: | 28.9 |
 The median response time based on all reported fire incidents is 6 minutes. This is similar to the state median value.
The median response time in Sausalito, CA compared to nearest cities:
(Note: Based on data for all years, including only cities with at least 500 fire incidents)
| Sausalito: | 6 minutes |
| Mill Valley: | 6 minutes |
| San Francisco: | 4 minutes |
| San Rafael: | 5 minutes |
| Richmond: | 7 minutes |
| San Pablo: | 7 minutes |
| Albany: | 4 minutes |
| El Cerrito: | 6 minutes |
| Daly City: | 4 minutes |
 29.2% incidents where reported in the morning and 70.8% in the evening. The most fires (17.5%) took place on Sunday, and the least (12.5%) on Monday.
 According to the 544 reports from years 2002 - 2018 most fires (12.1%) took place during September, and the least (5.9%) in December.
 Out of all 7,109 cases reported during the years 2002 - 2018, the most belonged to the categories: Rescue & EMS (53.9%), Good Intent Call (13.6%), and Service Call (9.6%).
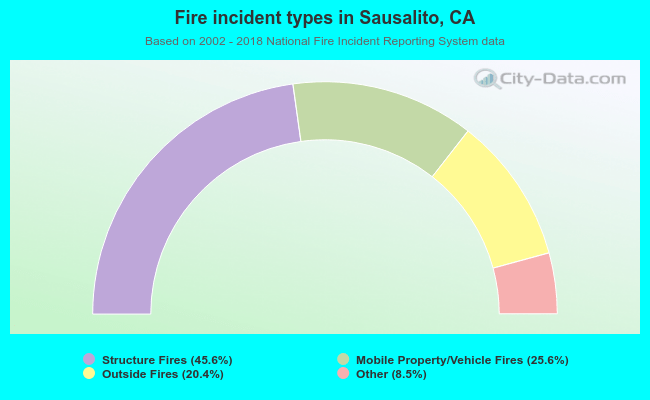 When looking into fire subcategories, the most incidents belonged to: Structure Fires (45.6%), and Mobile Property/Vehicle Fires (25.6%).