Monroe: Fire Incidents, Georgia (GA)
Where are fire incidents reported in Monroe, GA
Something went wrong! Please refresh the page.
| Fire incidents reported | |
|---|---|
| Sreet name | Count |
| SPRING ST | 180 |
| BROAD ST | 176 |
| HIGHWAY 78 | 148 |
| HIGHWAY 11 | 136 |
| BOLD SPRINGS RD | 62 |
| MARABLE ST | 62 |
| PANNELL RD | 62 |
| HWY 78 | 58 |
| MTN CREEK CHURCH RD | 52 |
| HIGHWAY 138 | 50 |
| MADISON AVE | 50 |
| SHOAL CREEK RD | 50 |
| HIGHWAY 81 | 48 |
| MONROE JERSEY RD | 48 |
| MT VERNON RD | 46 |
| DAVIS ST | 44 |
| TANGLEWOOD DR | 42 |
| H D ATHA RD | 40 |
| VINE ST | 40 |
| CHURCH ST | 38 |
| WALTON RD | 38 |
| UNISIA DR | 36 |
| PLAZA TRCE | 34 |
| ROSCOE DAVIS RD | 34 |
| HARRY ARNOLD RD | 32 |
| OLD MONROE MADISON HWY | 32 |
| DOUBLE SPRINGS CHURCH RD | 28 |
| DOUBLE SPRINGS RD | 28 |
| LABOON RD | 28 |
| NUNNALLY FARM RD | 28 |
| Other | 801 |
2002 - 2018 National Fire Incident Reporting System (NFIRS) incidents
- Incident types reported to NFIRS in Monroe, GA
- 10,66152.2%Rescue & EMS
- 3,37516.5%Good Intent Call
- 2,55112.5%Fire
- 1,4277.0%Service Call
- 1,3106.4%Hazardous Condition
- 7973.9%False Alarm
- 2791.4%Severe Weather
- Fire incident types reported to NFIRS in Monroe, GA
- 1,18546.5%Outside Fires
- 99138.8%Structure Fires
- 35513.9%Mobile Property/Vehicle Fires
- 200.8%Other
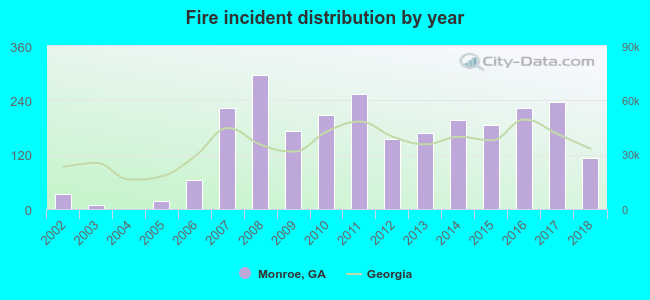 According to the data from the years 2002 - 2018 the average number of fire incidents per year is 150. The highest number of fires - 295 took place in 2008, and the least - 0 in 2004. The data has an increasing trend.
The average number of yearly fire incidents per 10k residents in Monroe, GA compared to nearest cities:
(Note: Based on data for the last 3 years, including only cities with population 5,000 and above)
| Monroe: | 139.5 |
| Loganville: | 153.9 |
| Winder: | 88.4 |
| Covington: | 246.6 |
| Auburn: | 68.5 |
| Snellville: | 80.4 |
| Conyers: | 159.9 |
| Lawrenceville: | 146.9 |
| Braselton: | 46.2 |
 The median response time based on all reported fire incidents is 6 minutes. This is similar to the Georgia median value.
The median response time in Monroe, GA compared to nearest cities:
(Note: Based on data for all years, including only cities with at least 500 fire incidents)
| Monroe: | 6 minutes |
| Loganville: | 7 minutes |
| Statham: | 8 minutes |
| Winder: | 6 minutes |
| Oxford: | 9 minutes |
| Covington: | 7 minutes |
| Auburn: | 7 minutes |
| Dacula: | 8 minutes |
| Snellville: | 8 minutes |
 According to the data from the years 2002 - 2018 the average number of fire-related yearly deaths is 0. The highest number of reported deaths - 3 took place in 2017, and the lowest - 0 in 2002. The data has a constant trend.
The average number of deaths per 1,000 fires is 1. This indicator was the highest - 13 in 2017, and the lowest 0 in 2002. The trend for deaths per 1,000 fires is constant. Compared to the state value the number of deaths per 1,000 incidents is similar.
According to the data from the years 2002 - 2018 the average number of fire-related yearly deaths is 0. The highest number of reported deaths - 3 took place in 2017, and the lowest - 0 in 2002. The data has a constant trend.
The average number of deaths per 1,000 fires is 1. This indicator was the highest - 13 in 2017, and the lowest 0 in 2002. The trend for deaths per 1,000 fires is constant. Compared to the state value the number of deaths per 1,000 incidents is similar.Deaths per 1,000 incidents in Monroe, GA compared to nearest cities:
(Note: Based on data for all years, including only cities with at least 2,500 fire incidents)
| Monroe: | 2.0 |
| Loganville: | 1.2 |
| Covington: | 0.8 |
| Conyers: | 3.2 |
| Lawrenceville: | 2.5 |
| Athens: | 2.1 |
| Lithonia: | 1.6 |
| Stone Mountain: | 2.3 |
| Buford: | 2.2 |
 According to the data from the years 2002 - 2018 the average number of fire-related casualties per year is 1. The highest number of reported casualties - 4 took place in 2017, and the lowest - 0 in 2002. The data has a rising trend.
The average number of injuries per 1,000 fires is 7. This indicator was the highest - 32 in 2006, and the lowest 0 in 2002. The trend for casualties per 1,000 fire incidents is increasing. Compared to the state value the number of casualties per 1,000 fire incidents is about the same.
According to the data from the years 2002 - 2018 the average number of fire-related casualties per year is 1. The highest number of reported casualties - 4 took place in 2017, and the lowest - 0 in 2002. The data has a rising trend.
The average number of injuries per 1,000 fires is 7. This indicator was the highest - 32 in 2006, and the lowest 0 in 2002. The trend for casualties per 1,000 fire incidents is increasing. Compared to the state value the number of casualties per 1,000 fire incidents is about the same.Casualties per 1,000 incidents in Monroe, GA compared to nearest cities:
(Note: Based on data for all years, including only cities with at least 500 fire incidents)
| Monroe: | 7.8 |
| Loganville: | 10.4 |
| Statham: | 3.8 |
| Winder: | 5.3 |
| Oxford: | 2.0 |
| Covington: | 8.7 |
| Auburn: | 6.3 |
| Dacula: | 23.3 |
| Snellville: | 22.7 |
 23.3% incidents where reported in the morning and 76.7% in the evening. The most fires (16.7%) took place on Saturday, and the least (13.0%) on Tuesday.
 According to the 2,551 fire incidents from years 2002 - 2018 most fires (12.5%) took place during March, and the least (5.8%) in September.
 Out of all 20,429 cases reported during the years 2002 - 2018, the most belonged to the categories: Rescue & EMS (52.2%), Good Intent Call (16.5%), and Fire (12.5%).
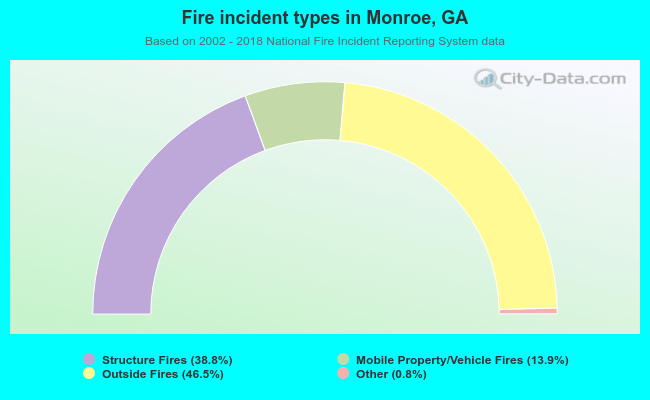 When looking into fire subcategories, the most incidents belonged to: Outside Fires (46.5%), and Structure Fires (38.8%).