Athens: Fire Incidents, Georgia (GA)
Where are fire incidents reported in Athens, GA
Something went wrong! Please refresh the page.
| Fire incidents reported | |
|---|---|
| Sreet name | Count |
| ATLANTA HWY | 310 |
| BROAD ST | 300 |
| LEXINGTON RD | 284 |
| SPRING VALLEY RD | 184 |
| DANIELSVILLE RD | 178 |
| BARNETT SHOALS RD | 174 |
| MILLEDGE AVE | 170 |
| GA 10 LOOP | 162 |
| BAXTER ST | 154 |
| COMMERCE RD | 152 |
| PRINCE AVE | 146 |
| NORTH AVE | 138 |
| OLD HULL RD | 136 |
| LUMPKIN ST | 130 |
| SYCAMORE DR | 120 |
| ATHENA DR | 116 |
| LOOP 10 | 112 |
| HAWTHORNE AVE | 108 |
| OCONEE ST | 108 |
| JEFFERSON RD | 96 |
| TALLASSEE RD | 84 |
| OAK HILL DR | 82 |
| COLLEGE STATION RD | 80 |
| FOURTH ST | 78 |
| US 29 HWY | 78 |
| GAINES SCHOOL RD | 76 |
| HIGHWAY 29 | 76 |
| WINTERVILLE RD | 76 |
| CEDAR SHOALS DR | 74 |
| TIMOTHY RD | 68 |
| Other | 2,513 |
2003 - 2018 National Fire Incident Reporting System (NFIRS) incidents
- Incident types reported to NFIRS in Athens, GA
- 7,64826.5%Rescue & EMS
- 6,71123.3%Hazardous Condition
- 6,56322.7%Fire
- 3,98513.8%False Alarm
- 2,2347.7%Good Intent Call
- 1,4505.0%Service Call
- 1300.5%Overpressure Rupture
- 870.3%Severe Weather
- 480.2%Special Incident
- Fire incident types reported to NFIRS in Athens, GA
- 2,89244.1%Outside Fires
- 2,22133.8%Structure Fires
- 1,36020.7%Mobile Property/Vehicle Fires
- 901.4%Other
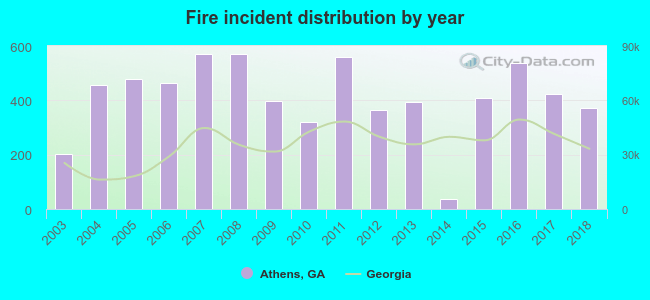 Based on the data from the years 2003 - 2018 the average number of fires per year is 410. The highest number of fires - 571 took place in 2007, and the least - 38 in 2014. The data has an increasing trend.
The average number of yearly fire incidents per 10k residents in Athens, GA compared to nearest cities:
(Note: Based on data for the last 3 years, including only cities with population 5,000 and above)
| Athens: | 52.2 |
| Jefferson: | 133.8 |
| Commerce: | 170.2 |
| Winder: | 88.4 |
| Monroe: | 139.5 |
| Braselton: | 46.2 |
| Auburn: | 68.5 |
| Loganville: | 153.9 |
| Lawrenceville: | 146.9 |
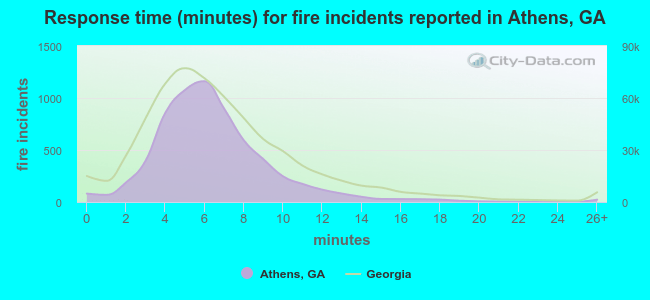 The median response time based on all reported fire incidents is 6 minutes. This is similar to the state median value.
The median response time in Athens, GA compared to nearest cities:
(Note: Based on data for all years, including only cities with at least 500 fire incidents)
| Athens: | 6 minutes |
| Watkinsville: | 7 minutes |
| Statham: | 8 minutes |
| Jefferson: | 8 minutes |
| Commerce: | 9 minutes |
| Winder: | 6 minutes |
| Monroe: | 6 minutes |
| Madison: | 9 minutes |
| Auburn: | 7 minutes |
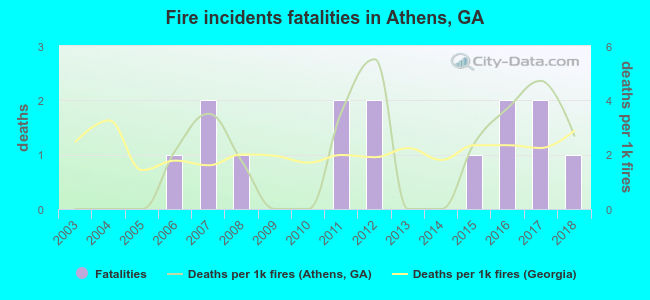 Based on the data from the years 2003 - 2018 the average number of fire-related yearly deaths is 1. The highest number of reported deaths - 2 took place in 2007, and the lowest - 0 in 2003. The data has a rising trend.
The average number of fatalities per 1,000 fires is 2. This indicator was the highest - 6 in 2012, and the lowest 0 in 2003. The trend for fatalities per 1,000 fire incidents is increasing. Compared to the state value the number of deaths per 1,000 fire incidents is about the same.
Based on the data from the years 2003 - 2018 the average number of fire-related yearly deaths is 1. The highest number of reported deaths - 2 took place in 2007, and the lowest - 0 in 2003. The data has a rising trend.
The average number of fatalities per 1,000 fires is 2. This indicator was the highest - 6 in 2012, and the lowest 0 in 2003. The trend for fatalities per 1,000 fire incidents is increasing. Compared to the state value the number of deaths per 1,000 fire incidents is about the same.Deaths per 1,000 incidents in Athens, GA compared to nearest cities:
(Note: Based on data for all years, including only cities with at least 2,500 fire incidents)
| Athens: | 2.1 |
| Monroe: | 2.0 |
| Loganville: | 1.2 |
| Lawrenceville: | 2.5 |
| Gainesville: | 2.1 |
 Based on the reports from the years 2003 - 2018 the average number of fire-related casualties per year is 5. The highest number of casualties - 13 took place in 2013, and the lowest - 0 in 2014. The data has a dropping trend.
The average number of casualties per 1,000 fire incidents is 11. This indicator was the highest - 33 in 2013, and the lowest 0 in 2014. The trend for injuries per 1,000 fires is declining. Compared to the Georgia value the number of injuries per 1,000 fires is higher.
Based on the reports from the years 2003 - 2018 the average number of fire-related casualties per year is 5. The highest number of casualties - 13 took place in 2013, and the lowest - 0 in 2014. The data has a dropping trend.
The average number of casualties per 1,000 fire incidents is 11. This indicator was the highest - 33 in 2013, and the lowest 0 in 2014. The trend for injuries per 1,000 fires is declining. Compared to the Georgia value the number of injuries per 1,000 fires is higher.
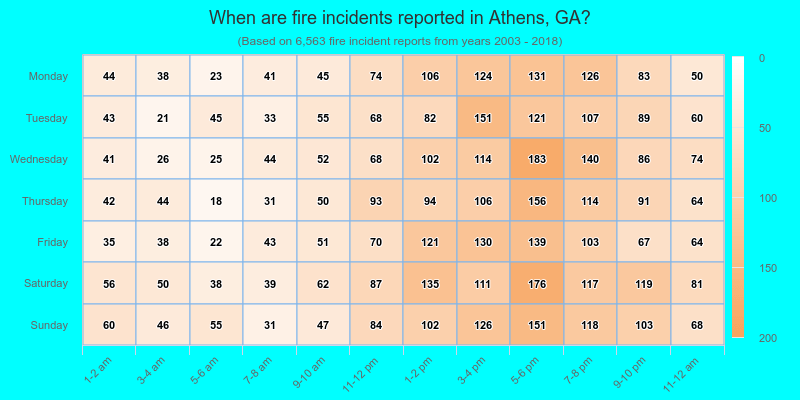
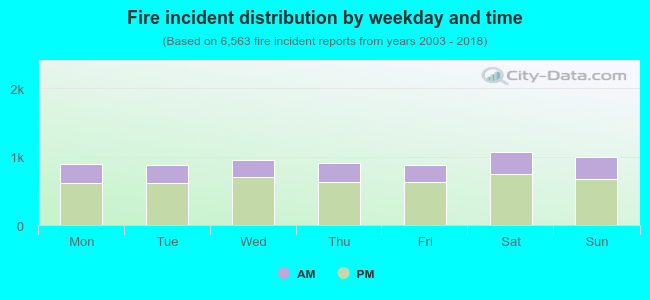 30.1% incidents where reported in the morning and 69.9% in the evening. The most fires (16.3%) took place on Saturday, and the least (13.3%) on Tuesday.
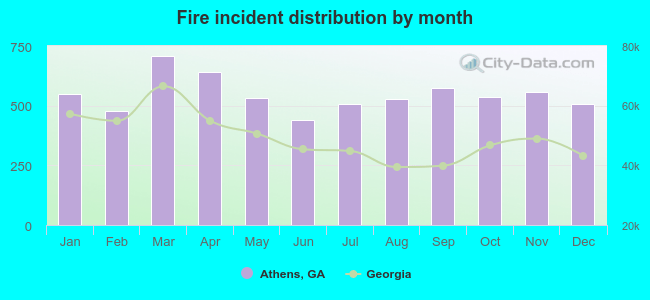 According to the 6,563 fire incidents from years 2003 - 2018 most fires (10.8%) took place during March, and the least (6.7%) in June.
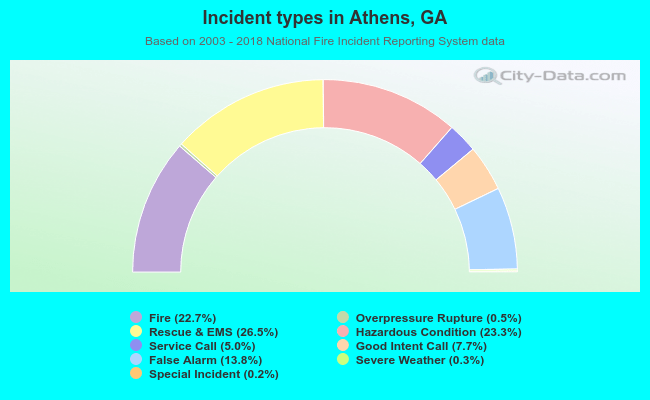 Out of all 28,856 cases reported during the years 2003 - 2018, the most belonged to the categories: Rescue & EMS (26.5%), Hazardous Condition (23.3%), and Fire (22.7%).
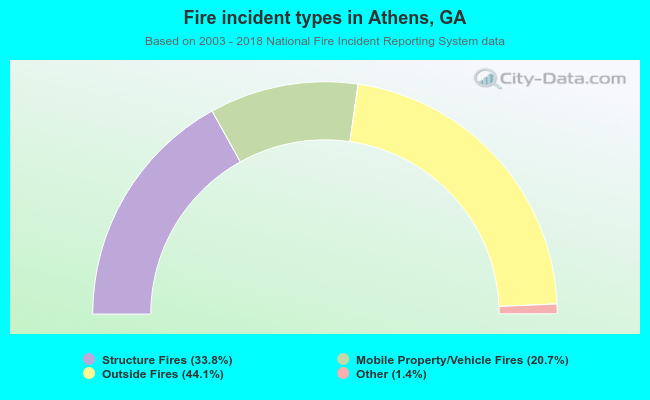 When looking into fire subcategories, the most reports belonged to: Outside Fires (44.1%), and Structure Fires (33.8%).