Lemoore: Fire Incidents, California (CA)
Where are fire incidents reported in Lemoore, CA
Something went wrong! Please refresh the page.
| Fire incidents reported | |
|---|---|
| Sreet name | Count |
| HIGHWAY 198 | 174 |
| HANFORD ARMONA RD | 166 |
| 19TH AVE | 140 |
| 18TH AVE | 116 |
| 17TH AVE | 108 |
| HIGHWAY 41 | 88 |
| LEMOORE AVE | 82 |
| GRANGEVILLE BLVD | 72 |
| ALKALI DR | 68 |
| JERSEY AVE | 66 |
| BUSH ST | 64 |
| CINNAMON DR | 62 |
| SALTGRASS DR | 58 |
| D ST | 56 |
| JACKSON AVE | 52 |
| FREMONT AVE | 46 |
| HAZELWOOD DR | 46 |
| 21ST AVE | 42 |
| LACEY BLVD | 42 |
| SALTGRASS CT | 42 |
| 16TH AVE | 38 |
| IONA AVE | 38 |
| YOKUT CT | 32 |
| 25TH AVE | 30 |
| EAST RD | 30 |
| 19 AND ONE HALF AVE | 28 |
| SOUTH RD | 28 |
| 19 12 AVE | 26 |
| 22ND AVE | 26 |
| ELGIN AVE | 26 |
2005 - 2018 National Fire Incident Reporting System (NFIRS) incidents
- Incident types reported to NFIRS in Lemoore, CA
- 1,80936.4%Rescue & EMS
- 1,78936.0%Fire
- 53010.7%Hazardous Condition
- 4859.8%Good Intent Call
- 2615.3%Service Call
- 891.8%False Alarm
- 60.1%Special Incident
- Fire incident types reported to NFIRS in Lemoore, CA
- 1,06659.6%Outside Fires
- 40022.4%Structure Fires
- 29016.2%Mobile Property/Vehicle Fires
- 331.8%Other
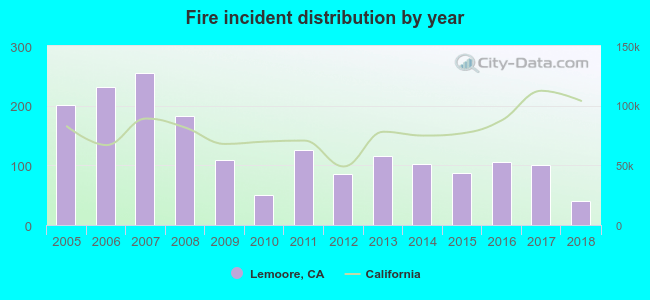 According to the data from the years 2005 - 2018 the average number of fires per year is 128. The highest number of fire incidents - 254 took place in 2007, and the least - 40 in 2018. The data has a dropping trend.
The average number of yearly fire incidents per 10k residents in Lemoore, CA compared to nearest cities:
(Note: Based on data for the last 3 years, including only cities with population 5,000 and above)
| Lemoore: | 32.6 |
| Hanford: | 53.5 |
| Huron: | 110.2 |
| Corcoran: | 23.5 |
| Kingsburg: | 79.8 |
| Selma: | 122.0 |
| Fowler: | 80.0 |
| Parlier: | 45.4 |
| Tulare: | 50.4 |
 The median response time based on all reported fire incidents is 7 minutes. This is comparable to the California median value.
The median response time in Lemoore, CA compared to nearest cities:
(Note: Based on data for all years, including only cities with at least 500 fire incidents)
| Lemoore: | 7 minutes |
| Hanford: | 7 minutes |
| Riverdale: | 14 minutes |
| Caruthers: | 10 minutes |
| Huron: | 9 minutes |
| Corcoran: | 6 minutes |
| Kingsburg: | 7 minutes |
| Selma: | 6 minutes |
| Easton: | 7 minutes |
 32.9% incidents where reported in the morning and 67.1% in the evening. The most fires (16.4%) took place on Saturday, and the least (12.4%) on Wednesday.
 According to the 1,789 fire incident reports from years 2005 - 2018 most fires (13.9%) took place during June, and the least (5.3%) in February.
 Out of all 4,971 cases reported during the years 2005 - 2018, the most belonged to the categories: Rescue & EMS (36.4%), Fire (36.0%), and Hazardous Condition (10.7%).
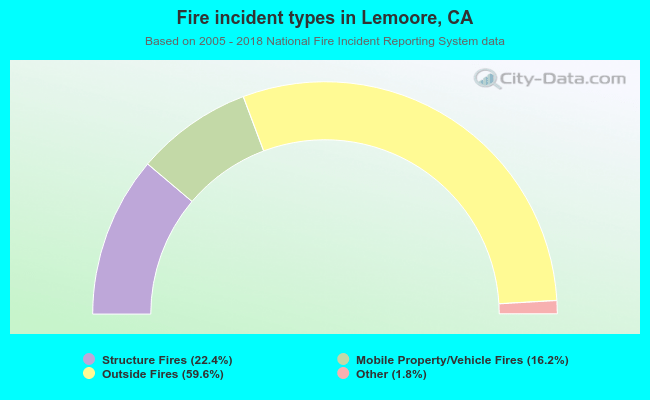 When looking into fire subcategories, the most incidents belonged to: Outside Fires (59.6%), and Structure Fires (22.4%).