Selma: Fire Incidents, California (CA)
Where are fire incidents reported in Selma, CA
Something went wrong! Please refresh the page.
| Fire incidents reported | |
|---|---|
| Sreet name | Count |
| FLORAL | 280 |
| MCCALL | 174 |
| THOMPSON | 168 |
| DINUBA | 160 |
| HIGHLAND | 148 |
| NEBRASKA | 140 |
| ROSE | 110 |
| HUNTSMAN | 94 |
| HIGHLAND AVE | 76 |
| GOLDEN STATE | 64 |
| FLORAL AVE | 60 |
| WHITSON | 58 |
| MCCALL AVE | 56 |
| NEBRASKA AVE | 54 |
| NELSON | 52 |
| THOMPSON AVE | 52 |
| CLOVIS | 48 |
| FOWLER | 48 |
| HWY 99 | 48 |
| KAMM | 48 |
| MOUNTAIN VIEW | 48 |
| PARK | 44 |
| PEACH | 44 |
| SHAFT | 44 |
| DEWOLF | 42 |
| TEMPERANCE | 40 |
| DE WOLF | 38 |
| MANNING | 36 |
| WILLOW | 36 |
| CONEJO | 34 |
| Other | 115 |
2005 - 2018 National Fire Incident Reporting System (NFIRS) incidents
- Incident types reported to NFIRS in Selma, CA
- 8,65258.2%Rescue & EMS
- 2,45916.6%Fire
- 1,82912.3%Good Intent Call
- 9126.1%Service Call
- 4993.4%Hazardous Condition
- 4933.3%False Alarm
- Fire incident types reported to NFIRS in Selma, CA
- 1,13346.1%Outside Fires
- 73730.0%Structure Fires
- 51621.0%Mobile Property/Vehicle Fires
- 733.0%Other
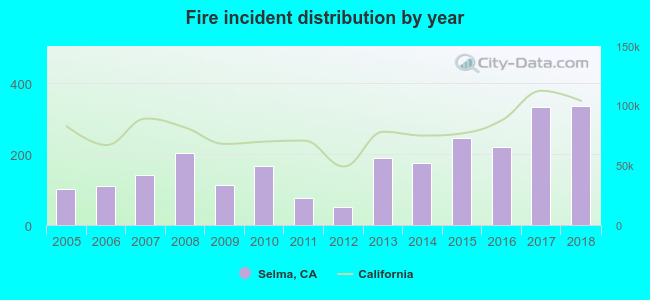 According to the data from the years 2005 - 2018 the average number of fires per year is 176. The highest number of fire incidents - 337 took place in 2018, and the least - 50 in 2012. The data has a rising trend.
The average number of yearly fire incidents per 10k residents in Selma, CA compared to nearest cities:
(Note: Based on data for the last 3 years, including only cities with population 5,000 and above)
| Selma: | 122.0 |
| Parlier: | 45.4 |
| Kingsburg: | 79.8 |
| Fowler: | 80.0 |
| Reedley: | 26.7 |
| Sanger: | 67.4 |
| Dinuba: | 52.3 |
| Hanford: | 53.5 |
| Orange Cove: | 121.0 |
 The median response time based on all reported fire incidents is 6 minutes. This is comparable to the state median value.
The median response time in Selma, CA compared to nearest cities:
(Note: Based on data for all years, including only cities with at least 500 fire incidents)
| Selma: | 6 minutes |
| Parlier: | 11 minutes |
| Kingsburg: | 7 minutes |
| Reedley: | 13 minutes |
| Sanger: | 8 minutes |
| Easton: | 7 minutes |
| Dinuba: | 5 minutes |
| Caruthers: | 10 minutes |
| Hanford: | 7 minutes |
 According to the reports from the years 2005 - 2018 the average number of fire-related casualties per year is 0. The highest number of casualties - 3 took place in 2005, and the lowest - 0 in 2007. The data has a dropping trend.
The average number of casualties per 1,000 fires is 4. This indicator was the highest - 29 in 2005, and the lowest 0 in 2007. The trend for casualties per 1,000 incidents is declining. Compared to the state value the number of injuries per 1,000 fires is much lower.
According to the reports from the years 2005 - 2018 the average number of fire-related casualties per year is 0. The highest number of casualties - 3 took place in 2005, and the lowest - 0 in 2007. The data has a dropping trend.
The average number of casualties per 1,000 fires is 4. This indicator was the highest - 29 in 2005, and the lowest 0 in 2007. The trend for casualties per 1,000 incidents is declining. Compared to the state value the number of injuries per 1,000 fires is much lower.
 33.2% incidents where reported in the morning and 66.8% in the evening. The most fires (16.3%) took place on Sunday, and the least (12.6%) on Friday.
 According to the 2,459 fire incidents from years 2005 - 2018 most fires (11.8%) took place during July, and the least (6.0%) in February.
 Out of all 14,856 cases reported during the years 2005 - 2018, the most belonged to the categories: Rescue & EMS (58.2%), Fire (16.6%), and Good Intent Call (12.3%).
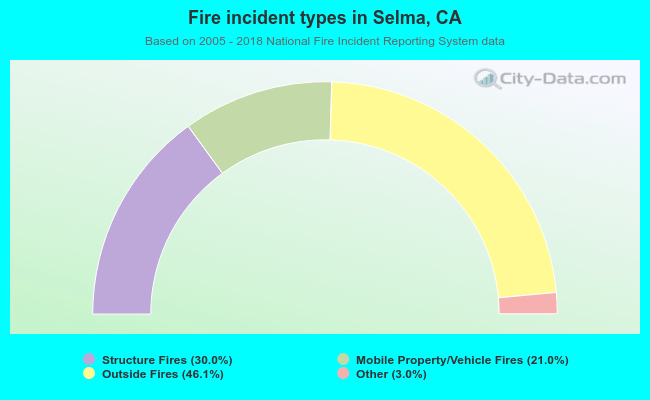 When looking into fire subcategories, the most incidents belonged to: Outside Fires (46.1%), and Structure Fires (30.0%).