Dinuba: Fire Incidents, California (CA)
Where are fire incidents reported in Dinuba, CA
Something went wrong! Please refresh the page.
| Fire incidents reported | |
|---|---|
| Sreet name | Count |
| ALTA AVE | 144 |
| EL MONTE WAY | 134 |
| CRAWFORD AVE | 78 |
| SIERRA WAY | 58 |
| EL MONTE | 54 |
| L ST | 54 |
| EUCLID AVE | 52 |
| COLLEGE AVE | 50 |
| KAMM AVE | 46 |
| TULARE ST | 44 |
| NEBRASKA AVE | 42 |
| AVE 416 | 40 |
| ROAD 80 | 40 |
| AVE 430 | 36 |
| GOLDEN WAY | 36 |
| K ST | 32 |
| NORTH WAY | 32 |
| J ST | 30 |
| PARK WAY | 30 |
| VILLA AVE | 30 |
| WHITTAKER WAY | 28 |
| BATES AVE | 24 |
| ROAD 72 | 24 |
| AVE 408 | 22 |
| M ST | 22 |
| OLIVE WAY | 22 |
| PARK | 22 |
| SECOND AVE | 22 |
| WHITNEY AVE | 22 |
| ACADEMY WAY | 20 |
| Other | 258 |
2005 - 2018 National Fire Incident Reporting System (NFIRS) incidents
- Incident types reported to NFIRS in Dinuba, CA
- 10,08170.7%Rescue & EMS
- 1,54810.9%Fire
- 9426.6%Good Intent Call
- 8055.6%Service Call
- 5533.9%Hazardous Condition
- 2962.1%False Alarm
- 200.1%Special Incident
- Fire incident types reported to NFIRS in Dinuba, CA
- 77750.2%Outside Fires
- 44628.8%Structure Fires
- 22114.3%Mobile Property/Vehicle Fires
- 1046.7%Other
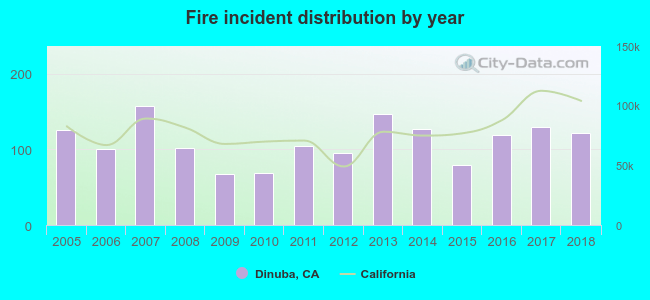 According to the data from the years 2005 - 2018 the average number of fire incidents per year is 111. The highest number of fire incidents - 158 took place in 2007, and the least - 68 in 2009. The data has a decreasing trend.
The average number of yearly fire incidents per 10k residents in Dinuba, CA compared to nearest cities:
(Note: Based on data for the last 3 years, including only cities with population 5,000 and above)
| Dinuba: | 52.3 |
| Reedley: | 26.7 |
| Orosi: | 42.0 |
| Cutler: | 47.3 |
| Orange Cove: | 121.0 |
| Parlier: | 45.4 |
| Kingsburg: | 79.8 |
| Selma: | 122.0 |
| Sanger: | 67.4 |
 The median response time based on all reported fire incidents is 5 minutes. This is lower compared to the California median value.
The median response time in Dinuba, CA compared to nearest cities:
(Note: Based on data for all years, including only cities with at least 500 fire incidents)
| Dinuba: | 5 minutes |
| Reedley: | 13 minutes |
| Orange Cove: | 5 minutes |
| Parlier: | 11 minutes |
| Kingsburg: | 7 minutes |
| Selma: | 6 minutes |
| Sanger: | 8 minutes |
| Visalia: | 6 minutes |
| Woodlake: | 7 minutes |
 According to the data from the years 2005 - 2018 the average number of fire-related casualties per year is 1. The highest number of injuries - 7 took place in 2006, and the lowest - 0 in 2008. The data has a declining trend.
The average number of casualties per 1,000 fires is 13. This indicator was the highest - 69 in 2006, and the lowest 0 in 2008. The trend for casualties per 1,000 incidents is declining. Compared to the state value the number of injuries per 1,000 fire incidents is much higher.
According to the data from the years 2005 - 2018 the average number of fire-related casualties per year is 1. The highest number of injuries - 7 took place in 2006, and the lowest - 0 in 2008. The data has a declining trend.
The average number of casualties per 1,000 fires is 13. This indicator was the highest - 69 in 2006, and the lowest 0 in 2008. The trend for casualties per 1,000 incidents is declining. Compared to the state value the number of injuries per 1,000 fire incidents is much higher.
 31.3% incidents where reported in the morning and 68.7% in the evening. The most fires (16.1%) took place on Saturday, and the least (12.6%) on Friday.
 Based on the 1,548 fire incident reports from years 2005 - 2018 most fires (10.9%) took place during June, and the least (6.2%) in March.
 Out of all 14,255 cases reported during the years 2005 - 2018, the most belonged to the categories: Rescue & EMS (70.7%), Fire (10.9%), and Good Intent Call (6.6%).
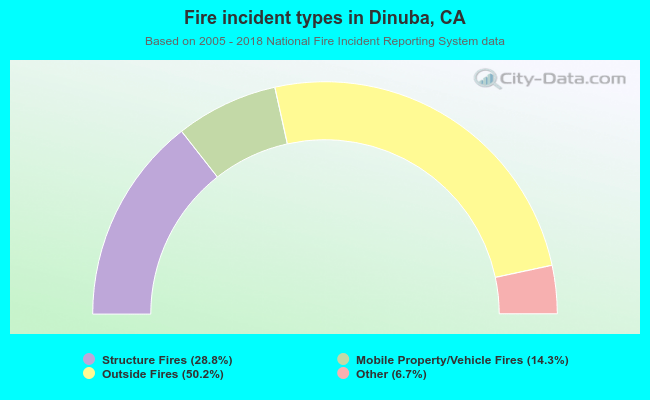 When looking into fire subcategories, the most incidents belonged to: Outside Fires (50.2%), and Structure Fires (28.8%).