Orosi: Fire Incidents, California (CA)
Where are fire incidents reported in Orosi, CA
Something went wrong! Please refresh the page.
|
| |||||||||||||||||||||||||||||||||||||||||||||||||||||||||||||||||||||||||||||||||||||||||||||||||||||||||||||
2005 - 2018 National Fire Incident Reporting System (NFIRS) incidents
- Incident types reported to NFIRS in Orosi, CA
- 3,60877.5%Rescue & EMS
- 47210.1%Good Intent Call
- 3527.6%Fire
- 942.0%Service Call
- 591.3%Hazardous Condition
- 551.2%False Alarm
- 110.2%Special Incident
- Fire incident types reported to NFIRS in Orosi, CA
- 20458.0%Outside Fires
- 8323.6%Structure Fires
- 4312.2%Mobile Property/Vehicle Fires
- 226.3%Other
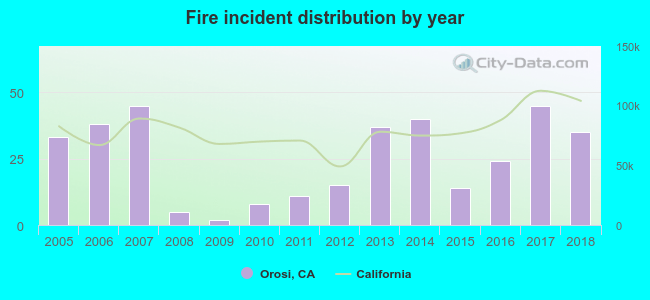 Based on the data from the years 2005 - 2018 the average number of fire incidents per year is 25. The highest number of reported fires - 45 took place in 2007, and the least - 2 in 2009. The data has an increasing trend.
The average number of yearly fire incidents per 10k residents in Orosi, CA compared to nearest cities:
(Note: Based on data for the last 3 years, including only cities with population 5,000 and above)
| Orosi: | 42.0 |
| Cutler: | 47.3 |
| Dinuba: | 52.3 |
| Orange Cove: | 121.0 |
| Reedley: | 26.7 |
| Woodlake: | 77.9 |
| Parlier: | 45.4 |
| Kingsburg: | 79.8 |
| Visalia: | 41.3 |

 31.5% incidents where reported in the morning and 68.5% in the evening. The most fires (19.3%) took place on Saturday, and the least (9.4%) on Thursday.
 Based on the 352 fire incident reports from years 2005 - 2018 most fires (19.3%) took place during May, and the least (4.5%) in February.
 Out of all 4,654 cases reported during the years 2005 - 2018, the most belonged to the categories: Rescue & EMS (77.5%), Good Intent Call (10.1%), and Fire (7.6%).
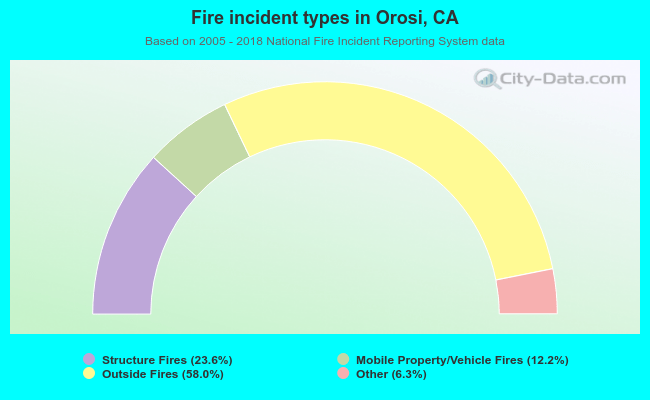 When looking into fire subcategories, the most reports belonged to: Outside Fires (58.0%), and Structure Fires (23.6%).