Tulare: Fire Incidents, California (CA)
Where are fire incidents reported in Tulare, CA
Something went wrong! Please refresh the page.
| Fire incidents reported | |
|---|---|
| Sreet name | Count |
| 99 FWY | 218 |
| K ST | 210 |
| BARDSLEY AVE | 192 |
| PROSPERITY AVE | 184 |
| TULARE AVE | 176 |
| I ST | 168 |
| WEST ST | 154 |
| LASPINA ST | 152 |
| CROSS AVE | 128 |
| H ST | 128 |
| BLACKSTONE ST | 116 |
| INYO AVE | 114 |
| F ST | 106 |
| J ST | 98 |
| E ST | 88 |
| KERN AVE | 80 |
| D ST | 70 |
| PLEASANT AVE | 70 |
| CARTMILL AVE | 62 |
| G ST | 60 |
| SACRAMENTO ST | 60 |
| SAN JOAQUIN AVE | 60 |
| MOONEY BLVD | 58 |
| O ST | 58 |
| PAIGE AVE | 58 |
| ENTERPRISE ST | 54 |
| SONORA AVE | 54 |
| SPRUCE ST | 54 |
| ALPINE AVE | 52 |
| H99 HWY | 52 |
| Other | 182 |
2005 - 2018 National Fire Incident Reporting System (NFIRS) incidents
- Incident types reported to NFIRS in Tulare, CA
- 11,11752.5%Rescue & EMS
- 3,31615.7%Fire
- 3,30815.6%Good Intent Call
- 1,4206.7%Service Call
- 1,2936.1%Hazardous Condition
- 6933.3%False Alarm
- Fire incident types reported to NFIRS in Tulare, CA
- 1,65149.8%Outside Fires
- 89627.0%Structure Fires
- 67920.5%Mobile Property/Vehicle Fires
- 902.7%Other
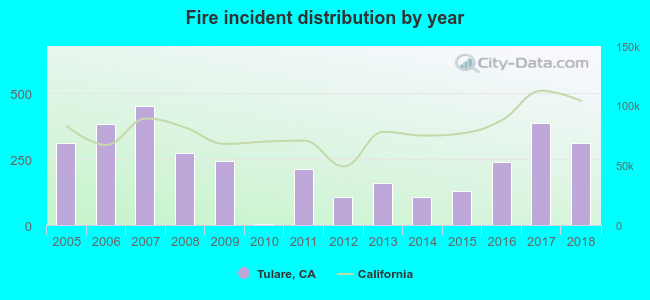 Based on the data from the years 2005 - 2018 the average number of fire incidents per year is 237. The highest number of fires - 453 took place in 2007, and the least - 3 in 2010. The data has a constant trend.
The average number of yearly fire incidents per 10k residents in Tulare, CA compared to nearest cities:
(Note: Based on data for the last 3 years, including only cities with population 5,000 and above)
| Tulare: | 50.4 |
| Visalia: | 41.3 |
| Farmersville: | 36.5 |
| Exeter: | 87.5 |
| Lindsay: | 35.6 |
| Corcoran: | 23.5 |
| Hanford: | 53.5 |
| Woodlake: | 77.9 |
| Porterville: | 54.1 |
 The median response time based on all reported fire incidents is 5 minutes. This is lower than the California median value.
The median response time in Tulare, CA compared to nearest cities:
(Note: Based on data for all years, including only cities with at least 500 fire incidents)
| Tulare: | 5 minutes |
| Visalia: | 6 minutes |
| Farmersville: | 5 minutes |
| Exeter: | 7 minutes |
| Lindsay: | 8 minutes |
| Corcoran: | 6 minutes |
| Hanford: | 7 minutes |
| Woodlake: | 7 minutes |
| Porterville: | 5 minutes |
 Based on the data from the years 2005 - 2018 the average number of fire-related casualties per year is 3. The highest number of casualties - 8 took place in 2007, and the lowest - 0 in 2010. The data has a declining trend.
The average number of injuries per 1,000 fires is 11. This indicator was the highest - 31 in 2015, and the lowest 0 in 2010. The trend for injuries per 1,000 incidents is decreasing. Compared to the state value the number of injuries per 1,000 fires is higher.
Based on the data from the years 2005 - 2018 the average number of fire-related casualties per year is 3. The highest number of casualties - 8 took place in 2007, and the lowest - 0 in 2010. The data has a declining trend.
The average number of injuries per 1,000 fires is 11. This indicator was the highest - 31 in 2015, and the lowest 0 in 2010. The trend for injuries per 1,000 incidents is decreasing. Compared to the state value the number of injuries per 1,000 fires is higher.Casualties per 1,000 incidents in Tulare, CA compared to nearest cities:
(Note: Based on data for all years, including only cities with at least 500 fire incidents)
| Tulare: | 11.2 |
| Visalia: | 13.4 |
| Farmersville: | 10.5 |
| Exeter: | 1.2 |
| Lindsay: | 1.8 |
| Corcoran: | 12.1 |
| Hanford: | 5.4 |
| Woodlake: | 0.0 |
| Porterville: | 7.7 |
 32.9% incidents where reported in the morning and 67.1% in the evening. The most fires (14.9%) took place on Monday, and the least (13.9%) on Saturday.
 According to the 3,316 fire incident reports from years 2005 - 2018 most fires (12.8%) took place during July, and the least (6.4%) in February.
 Out of all 21,187 cases reported during the years 2005 - 2018, the most belonged to the categories: Rescue & EMS (52.5%), Fire (15.7%), and Good Intent Call (15.6%).
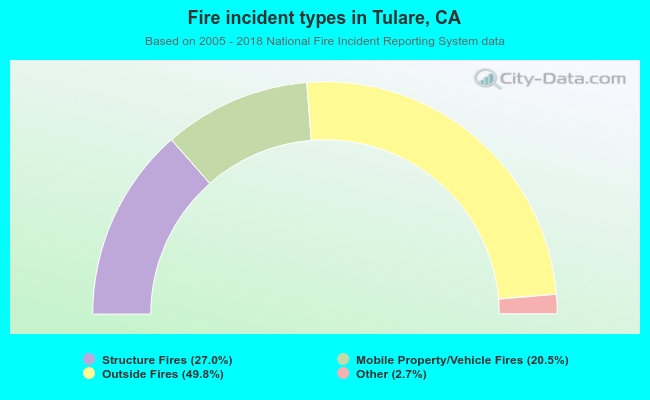 When looking into fire subcategories, the most incidents belonged to: Outside Fires (49.8%), and Structure Fires (27.0%).