Huntingdon: Fire Incidents, Pennsylvania (PA)
Where are fire incidents reported in Huntingdon, PA
Something went wrong! Please refresh the page.
|
| |||||||||||||||||||||||||||||||||||||||||||||||||||||||||||||||||||||||||||||||||||||||||||||||||||||||||||||
| Other | 56 | |||||||||||||||||||||||||||||||||||||||||||||||||||||||||||||||||||||||||||||||||||||||||||||||||||||||||||||
2003 - 2018 National Fire Incident Reporting System (NFIRS) incidents
- Incident types reported to NFIRS in Huntingdon, PA
- 53028.8%Fire
- 53028.8%Rescue & EMS
- 26914.6%Hazardous Condition
- 1749.5%False Alarm
- 1618.8%Good Intent Call
- 1297.0%Service Call
- 382.1%Severe Weather
- 50.3%Overpressure Rupture
- 30.2%Special Incident
- Fire incident types reported to NFIRS in Huntingdon, PA
- 33964.0%Structure Fires
- 12122.8%Outside Fires
- 509.4%Mobile Property/Vehicle Fires
- 203.8%Other
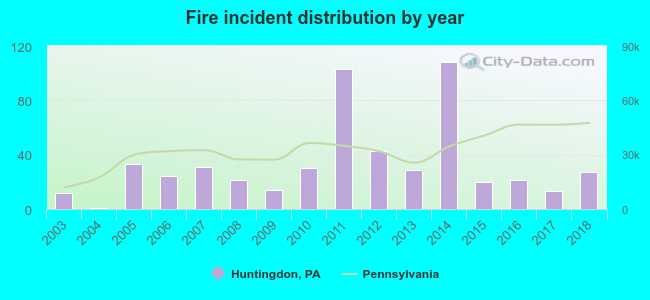 According to the data from the years 2003 - 2018 the average number of fire incidents per year is 33. The highest number of reported fire incidents - 108 took place in 2014, and the least - 1 in 2004. The data has an increasing trend.
The average number of yearly fire incidents per 10k residents in Huntingdon, PA compared to nearest cities:
(Note: Based on data for the last 3 years, including only cities with population 5,000 and above)
| Huntingdon: | 28.9 |
| Tyrone: | 77.4 |
| Altoona: | 16.9 |
| Hollidaysburg: | 57.1 |
| State College: | 23.9 |
| Lewistown: | 139.0 |
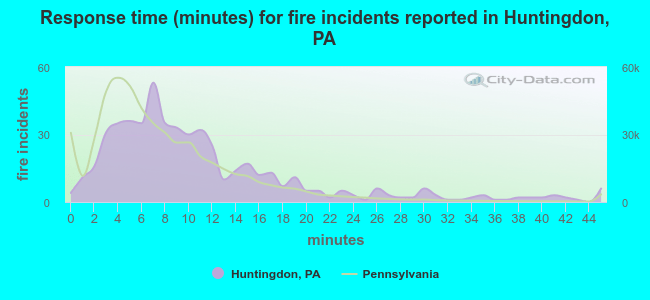 The median response time based on all reported fire incidents is 9 minutes. This is higher than the state median value.
The median response time in Huntingdon, PA compared to nearest cities:
(Note: Based on data for all years, including only cities with at least 500 fire incidents)
| Huntingdon: | 9 minutes |
| Altoona: | 4 minutes |
| State College: | 8 minutes |
| Lewistown: | 8 minutes |
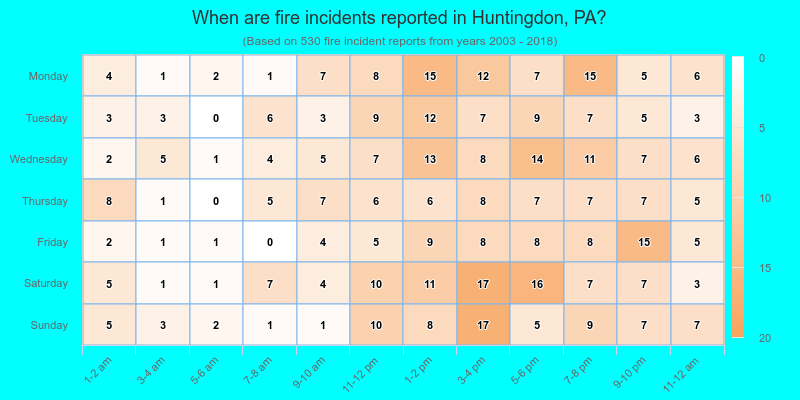
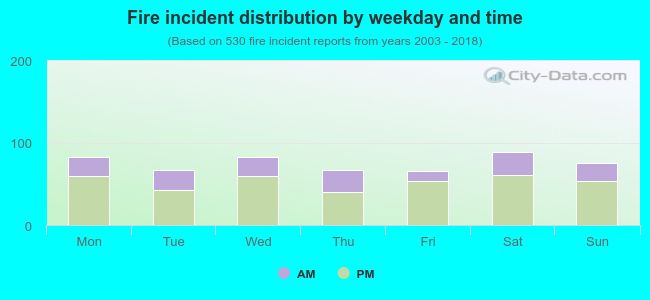 30.4% incidents where reported in the morning and 69.6% in the evening. The most fires (16.8%) took place on Saturday, and the least (12.5%) on Friday.
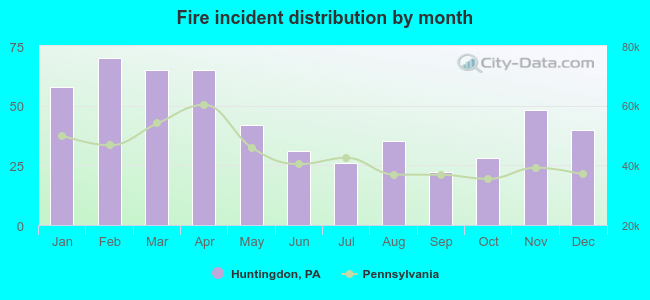 According to the 530 incident reports from years 2003 - 2018 most fires (13.2%) took place during February, and the least (4.2%) in September.
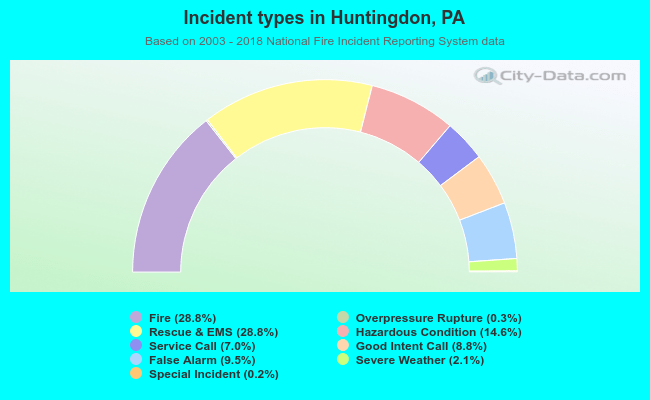 Out of all 1,839 cases reported during the years 2003 - 2018, the most belonged to the categories: Fire (28.8%), Rescue & EMS (28.8%), and Hazardous Condition (14.6%).
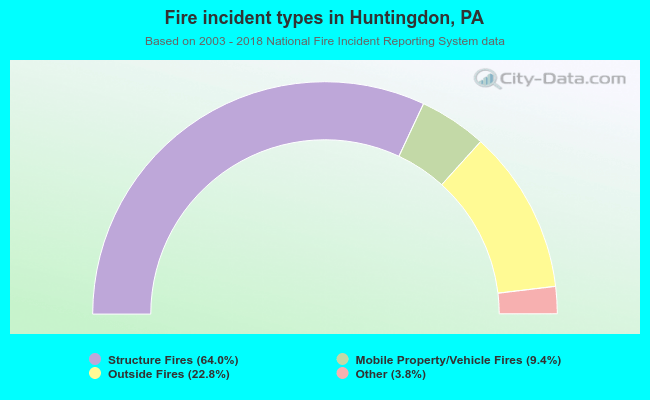 When looking into fire subcategories, the most incidents belonged to: Structure Fires (64.0%), and Outside Fires (22.8%).