Altoona: Fire Incidents, Pennsylvania (PA)
Where are fire incidents reported in Altoona, PA
Something went wrong! Please refresh the page.
| Fire incidents reported | |
|---|---|
| Sreet name | Count |
| 6TH AVE | 122 |
| 5TH AVE | 90 |
| GREEN AVE | 90 |
| 11TH ST | 78 |
| 8TH AVE | 68 |
| 4TH AVE | 64 |
| 2ND AVE | 60 |
| 7TH AVE | 48 |
| 3RD AVE | 46 |
| PLEASANT VALLEY BLVD | 46 |
| CHESTNUT AVE | 38 |
| BROAD AVE | 36 |
| 16TH AVE | 34 |
| BEALE AVE | 32 |
| 1ST AVE | 30 |
| MAPLE AVE | 28 |
| WALNUT AVE | 28 |
| 11TH AVE | 26 |
| 20TH AVE | 24 |
| 10TH ST | 22 |
| 12TH ST | 22 |
| WALTON AVE | 22 |
| 13TH AVE | 20 |
| 17TH AVE | 20 |
| 9TH AVE | 20 |
| LEXINGTON AVE | 20 |
| OAK AVE | 20 |
| UNION AVE | 20 |
| 16TH ST | 18 |
| HOWARD AVE | 18 |
2003 - 2018 National Fire Incident Reporting System (NFIRS) incidents
- Incident types reported to NFIRS in Altoona, PA
- 3,66735.3%Rescue & EMS
- 2,57924.8%Hazardous Condition
- 1,27512.3%False Alarm
- 1,04810.1%Fire
- 9399.0%Service Call
- 5785.6%Good Intent Call
- 1641.6%Special Incident
- 1281.2%Severe Weather
- 220.2%Overpressure Rupture
- Fire incident types reported to NFIRS in Altoona, PA
- 55853.2%Structure Fires
- 27125.9%Outside Fires
- 14714.0%Mobile Property/Vehicle Fires
- 726.9%Other
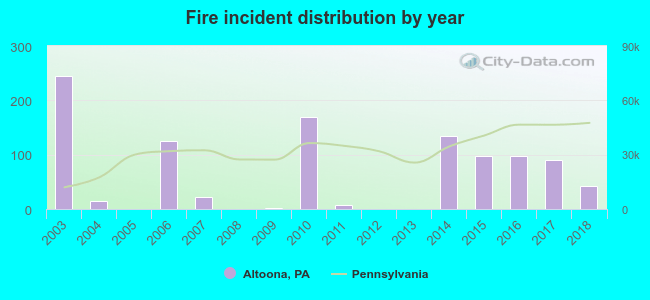 According to the data from the years 2003 - 2018 the average number of fires per year is 66. The highest number of reported fire incidents - 244 took place in 2003, and the least - 0 in 2005. The data has a decreasing trend.
The average number of yearly fire incidents per 10k residents in Altoona, PA compared to nearest cities:
(Note: Based on data for the last 3 years, including only cities with population 5,000 and above)
| Altoona: | 16.9 |
| Hollidaysburg: | 57.1 |
| Tyrone: | 77.4 |
| Huntingdon: | 28.9 |
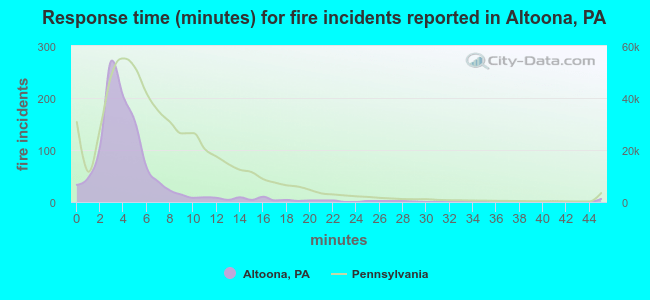 The median response time based on all reported fire incidents is 4 minutes. This is lower compared to the state median value.
The median response time in Altoona, PA compared to nearest cities:
(Note: Based on data for all years, including only cities with at least 500 fire incidents)
| Altoona: | 4 minutes |
| Huntingdon: | 9 minutes |
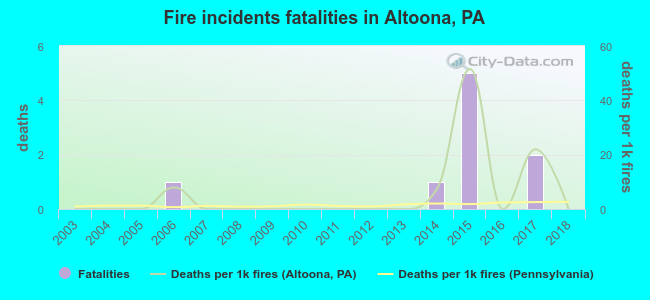 According to the reports from the years 2003 - 2018 the average number of fire-related yearly deaths is 1. The highest number of deaths - 5 took place in 2015, and the lowest - 0 in 2003. The data has a constant trend.
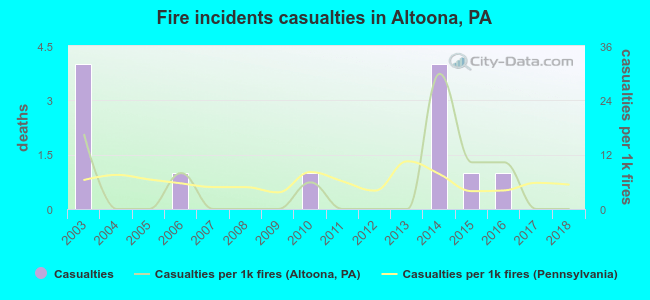 Based on the data from the years 2003 - 2018 the average number of fire-related yearly casualties is 1. The highest number of injuries - 4 took place in 2003, and the lowest - 0 in 2004. The data has a decreasing trend.
The average number of casualties per 1,000 fire incidents is 5. This indicator was the highest - 30 in 2014, and the lowest 0 in 2004. The trend for casualties per 1,000 fires is dropping. Compared to the state value the number of injuries per 1,000 fires is higher.
Based on the data from the years 2003 - 2018 the average number of fire-related yearly casualties is 1. The highest number of injuries - 4 took place in 2003, and the lowest - 0 in 2004. The data has a decreasing trend.
The average number of casualties per 1,000 fire incidents is 5. This indicator was the highest - 30 in 2014, and the lowest 0 in 2004. The trend for casualties per 1,000 fires is dropping. Compared to the state value the number of injuries per 1,000 fires is higher.Casualties per 1,000 incidents in Altoona, PA compared to nearest cities:
(Note: Based on data for all years, including only cities with at least 500 fire incidents)
| Altoona: | 11.5 |
| Huntingdon: | 1.9 |
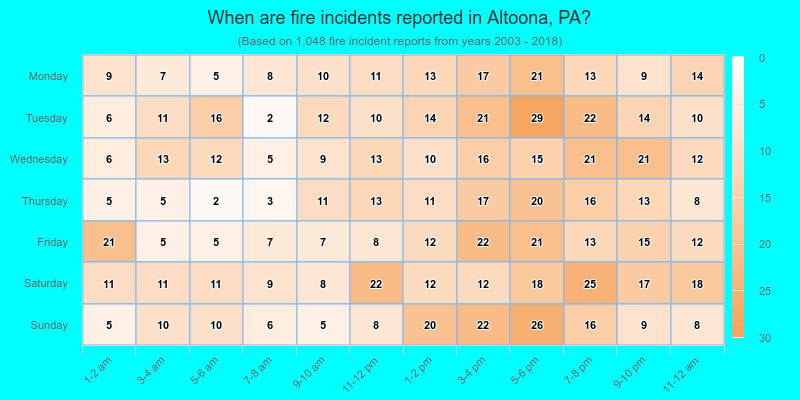
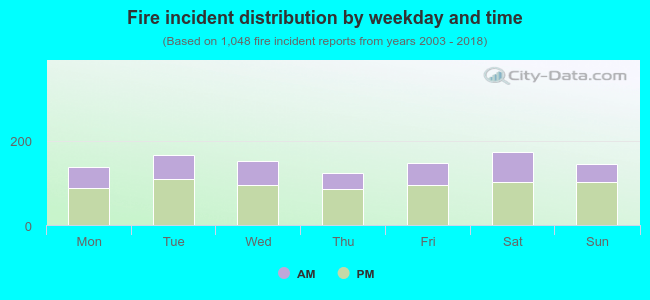 35.6% incidents where reported in the morning and 64.4% in the evening. The most fires (16.6%) took place on Saturday, and the least (11.8%) on Thursday.
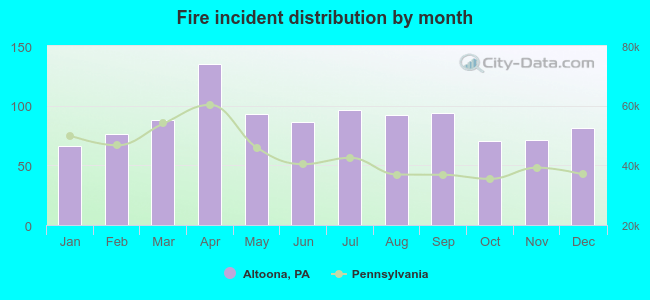 According to the 1,048 fire incident reports from years 2003 - 2018 most fires (12.9%) took place during April, and the least (6.3%) in January.
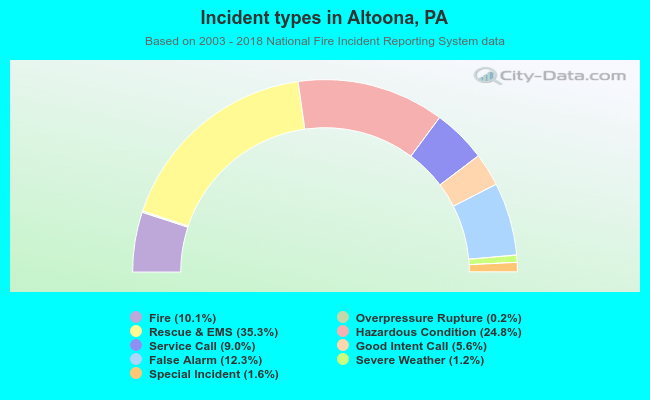 Out of all 10,400 cases reported during the years 2003 - 2018, the most belonged to the categories: Rescue & EMS (35.3%), Hazardous Condition (24.8%), and False Alarm (12.3%).
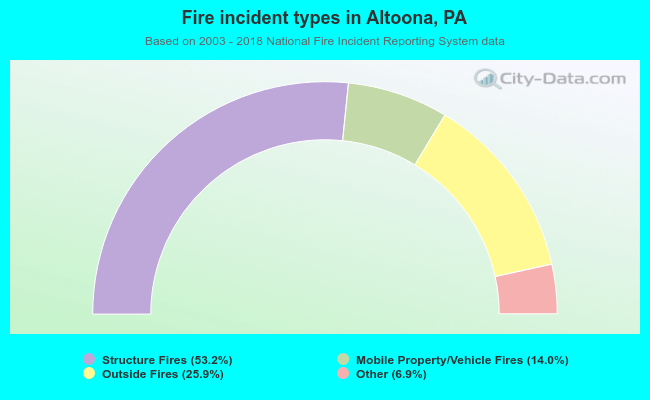 When looking into fire subcategories, the most incidents belonged to: Structure Fires (53.2%), and Outside Fires (25.9%).