Lewistown: Fire Incidents, Pennsylvania (PA)
Where are fire incidents reported in Lewistown, PA
Something went wrong! Please refresh the page.
| Fire incidents reported | |
|---|---|
| Sreet name | Count |
| VALLEY ST | 124 |
| FOURTH ST | 108 |
| US HIGHWAY 522 | 78 |
| CHESTNUT ST | 76 |
| MAIN ST | 66 |
| WALNUT ST | 58 |
| LOGAN ST | 50 |
| WAYNE ST | 48 |
| FIFTH ST | 44 |
| SHAW AVE | 42 |
| DRY VALLEY RD | 40 |
| MARKET ST | 40 |
| GRAND ST | 38 |
| PENNEBAKER AVE | 36 |
| MIDDLE RD | 34 |
| CENTRAL AVE | 32 |
| DORCAS ST | 32 |
| JUNIATA ST | 28 |
| HAWSTONE RD | 26 |
| PINE ST | 26 |
| THIRD ST | 26 |
| BACK MAITLAND RD | 24 |
| FEEDER AVE | 24 |
| FERGUSON VALLEY RD | 24 |
| GREEN AVE | 24 |
| BRATTON AVE | 22 |
| PINE RD | 20 |
| STATE ROUTE 103 | 20 |
| LEWLAND CIR | 18 |
| PHEASANT VALLEY RD | 18 |
2004 - 2018 National Fire Incident Reporting System (NFIRS) incidents
- Incident types reported to NFIRS in Lewistown, PA
- 1,65034.3%Rescue & EMS
- 1,22925.5%Fire
- 1,00420.9%Hazardous Condition
- 4329.0%Good Intent Call
- 2685.6%False Alarm
- 1843.8%Service Call
- 330.7%Special Incident
- 110.2%Severe Weather
- Fire incident types reported to NFIRS in Lewistown, PA
- 88572.0%Structure Fires
- 17214.0%Outside Fires
- 917.4%Mobile Property/Vehicle Fires
- 816.6%Other
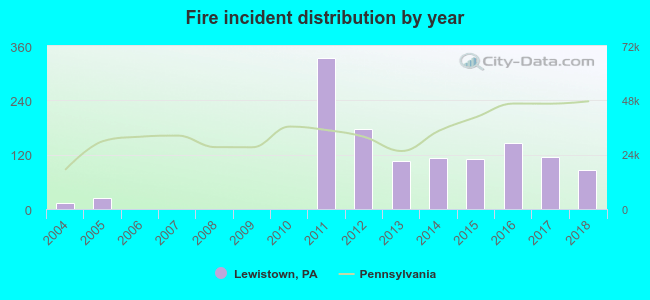 According to the data from the years 2004 - 2018 the average number of fire incidents per year is 82. The highest number of reported fire incidents - 333 took place in 2011, and the least - 0 in 2009. The data has a rising trend.
The average number of yearly fire incidents per 10k residents in Lewistown, PA compared to nearest cities:
(Note: Based on data for the last 3 years, including only cities with population 5,000 and above)
| Lewistown: | 139.0 |
| State College: | 23.9 |
| Huntingdon: | 28.9 |
| Bellefonte: | 29.4 |
 The median response time based on all reported fire incidents is 8 minutes. This is higher compared to the state median value.
The median response time in Lewistown, PA compared to nearest cities:
(Note: Based on data for all years, including only cities with at least 500 fire incidents)
| Lewistown: | 8 minutes |
| State College: | 8 minutes |
| Huntingdon: | 9 minutes |
| Bellefonte: | 10 minutes |
 38.6% incidents where reported in the morning and 61.4% in the evening. The most fires (17.9%) took place on Thursday, and the least (11.7%) on Sunday.
 Based on the 1,229 fires from years 2004 - 2018 most fires (14.4%) took place during April, and the least (5.4%) in May.
 Out of all 4,812 cases reported during the years 2004 - 2018, the most belonged to the categories: Rescue & EMS (34.3%), Fire (25.5%), and Hazardous Condition (20.9%).
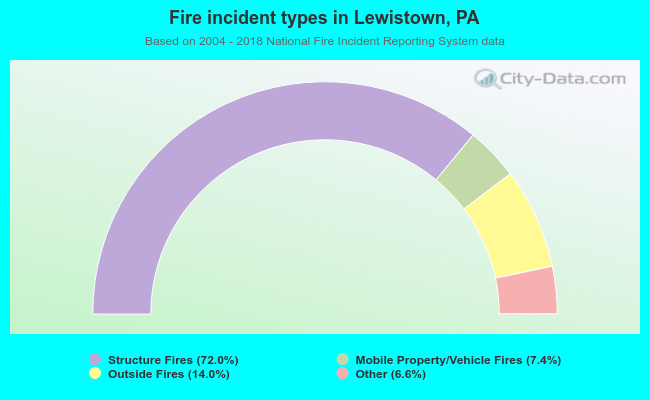 When looking into fire subcategories, the most incidents belonged to: Structure Fires (72.0%), and Outside Fires (14.0%).